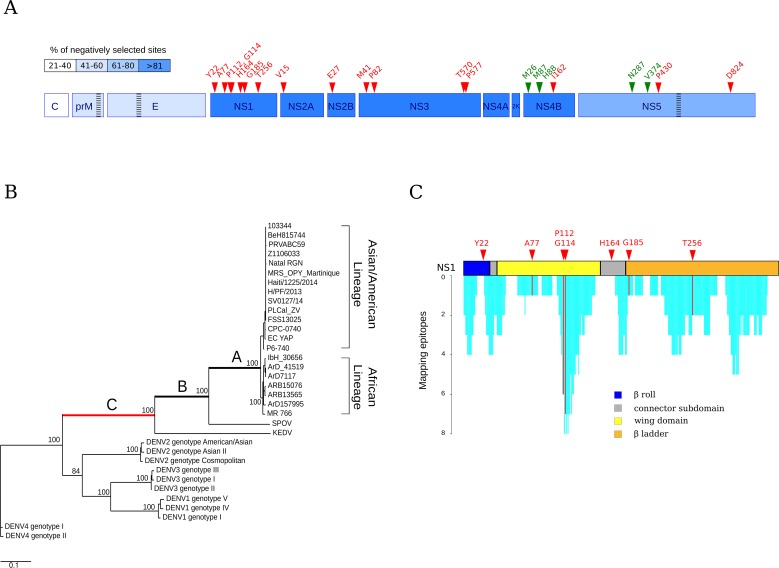
Fig 1. Different selective pressures acting on flavivirus polyproteins.
(A) Schematic representation of the ZIKV polyprotein. Proteins are colored in hues of blue depending on the percentage of negatively selected sites in ZIKV strains. The location of recombination breakpoints in flaviviruses and ZIKV is shown by striped rectangles. Positively selected sites in the flavivirus phylogeny and in ZIKV strains are colored in red and green, respectively. (B) Maximum likelihood unrooted tree for the flavivirus phylogeny. Branches analyzed in the branch-site tests are indicated with capital letters, with red indicating statistically significant evidence of positive selection. Branch length is proportional to nucleotide substitutions per codon. Bootstrap values for internal branches >75% are shown. See S1 Table for accession number and full names of analyzed viruses. (C) Immune epitope mapping and schematic representation of NS1 domains. Cyan bars indicate the number of epitopes overlapping each NS1 residue. Positively selected sites are also shown.

