
Fig. 3.
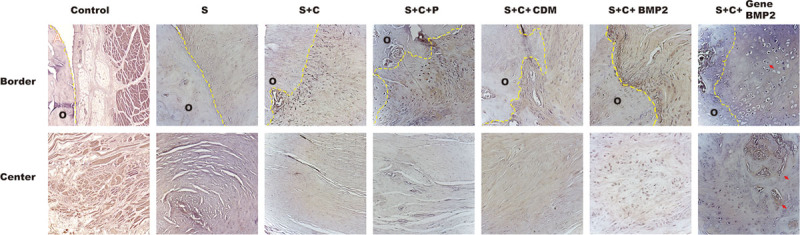
Alkaline phosphate activity in all the groups. Alkaline phosphate activity was the marker for osteoblasts. Control group: no osteoblasts were present in the control group. S group: chondrogenesis was observed at the border area, but no osteoblasts were found. S + C group: alkaline phosphate showed positive activity at the border but not in the center. Scaffold, cell, and periosteum group: osteoblast proliferation occurred at the border. CDM group: chondrogenesis was observed. S + C + BMP2 group: osteoblasts were detected at the border. Chondrogenesis also appears in the center. S + C + gene BMP2 group: bone formation was observed at the border and the center. The arrow indicates the new bone tissue. O indicate old bone area.