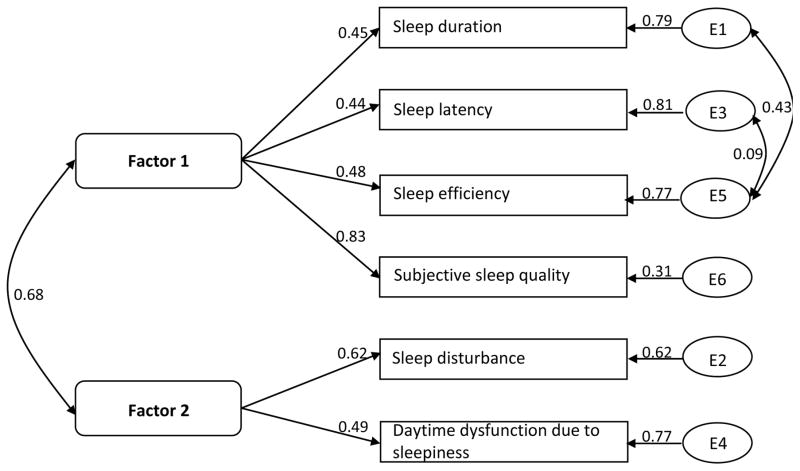
Figure 2.
Standardized regression weights for paths associated with the best fit model for the Pittsburgh Sleep Quality Index (PSQI) among pregnant women (N=1,488). Numbers next to arrows indicate factor loadings. Numbers next to error terms (left side of the figure) indicate correlation coefficients.

