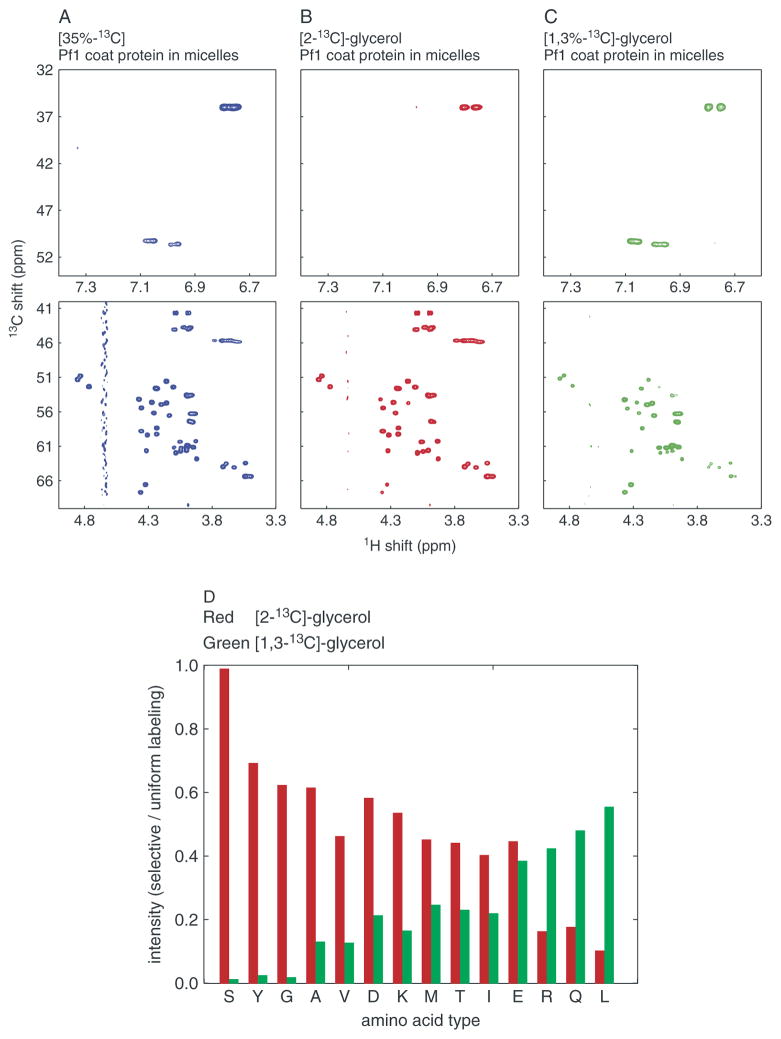
Figure 1.
Analysis of 13C labeling patterns. (A)–(C) Two-dimensional 1H/13C-HSQC solution-state NMR spectra of Pf1 coat protein in micelles. The top row shows the (aliased) correlation resonances from the aromatic carbons of the two tyrosine residues in the protein; the bottom row contains the correlation resonances from all of the alpha carbons in the protein: (A) 35% random fractional 13C Pf1 coat protein (left, blue); (B) metabolic labeling from [2-13C]-glycerol (middle, red); or from (C) [1,3-13C]-glycerol (right, green). (D) Relative signal intensity of α-carbons of different amino acids. The resonance intensities in the 1H/13C-HSQC spectra from [2-13C]-glycerol Pf1 coat protein (red) and [1,3-13C]-glycerol (green) are plotted as ratios relative to those of a uniformly 13C-labeled sample 13C Pf1 coat protein.

