Figure 6.
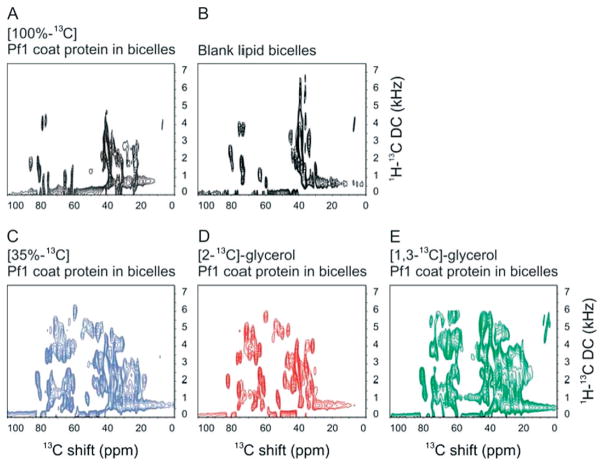
Two-dimensional 1H–13C PISEMA spectra of membrane-bound Pf1 coat protein in magnetically aligned bicelles. (A)–(E) The Cα and aliphatic region of different bicelle samples is compared in 1H–13C PISEMA spectra: (A) 100% uniformly 13C-labeled sample (black); (B) ‘Blank’ bicelle sample without protein; (C) 35% random fractional 13C-labeled sample (blue); (D) [2-13C]-glycerol-labeled sample (red); (E) [1,3-13C]-glycerol-labeled sample (green); The protein samples are uniformly 15N labeled with different 13C labeling schemes. All spectra resulted from signal-averaging of 192 scans and 64 points in the indirect dimension. The experimental data were zero-filled to 2 K and 4 K data points in the direct and indirect dimension, respectively, and multiplied by a sine bell window function before Fourier transformation.

