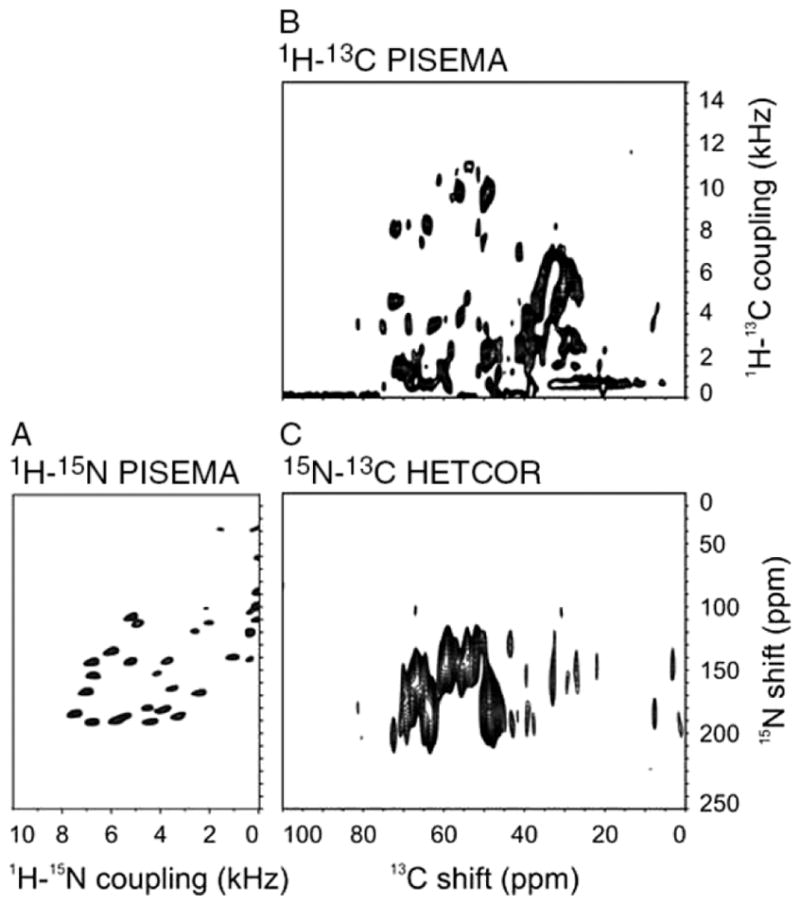
Figure 7.

Connectivity between two-dimensional PISEMA and HETCOR spectra. Two-dimensional NMR spectra of 1H–15N and 1H/13C heteronuclear dipolar couplings are plotted so that their chemical shift dimension is linked via the 13C/15N HETCOR heteronuclear chemical shift correlation spectrum: (A) 1H–15N PISEMA spectrum; (B) 1H/13C PISEMA spectrum; (C) 13C/15N HETCOR spectrum.
