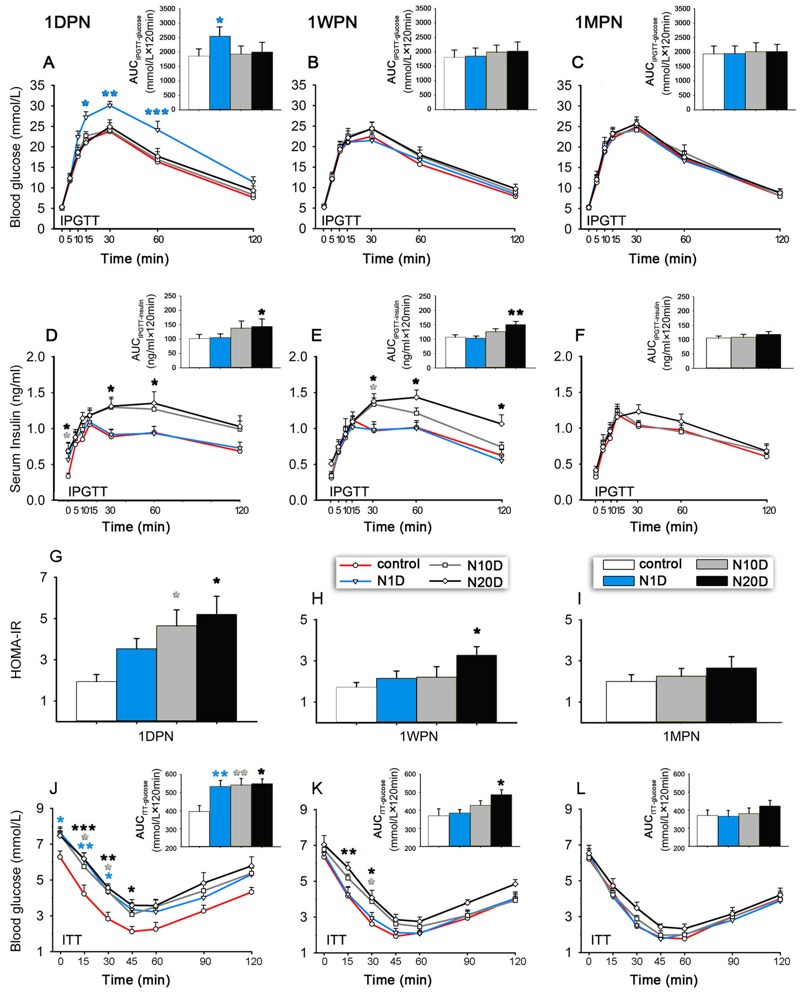
Figure 2.

Effects of noise exposure on glucose homeostasis in mice. N1D, N10D, and N20D indicate mice that were exposed to 1, 10, and 20 days of noise, respectively. (A–C) Blood glucose levels recorded during the intraperitoneal glucose tolerance test (IPGTT) in 16 hr-fasted mice performed at 1 day, 1 week, and 1 month after termination of noise exposure (1DPN, 1WPN, and 1MPN, respectively). (D–F) The serum insulin levels recorded during the IPGTT in 16 hr-fasted mice were obtained at 1DPN, 1WPN, and 1MPN. (G–I) The homeostasis model assessment–insulin resistance (HOMA-IR) in 16 hr-fasted mice was estimated at 1DPN, 1WPN, and 1MPN. (J–L) The blood glucose levels during the insulin tolerance test (ITT) in 4 hr-fasted mice were assessed at 1DPN, 1WPN, and 1MPN. Insets are the corresponding results of the IPGTT and ITT analyzed by the area under the curve (i.e., AUCIPGT-glucose, AUCIPGT-insulin, or AUCITT-glucose). Because the glucose tolerance and insulin response of the N1D group were the same as those of the controls at 1WPN, we did not measure the insulin response during the IPGTT of N1D at 1MPN. The values are presented as the means ± SEM of 8 mice per group. *p < 0.05, **p < 0.01 and ***p < 0.001 in post-hoc comparisons between each noise group and the controls after two-way repeated measures analysis of variance (ANOVA) or one-way ANOVA, showing a significant effect of noise.
