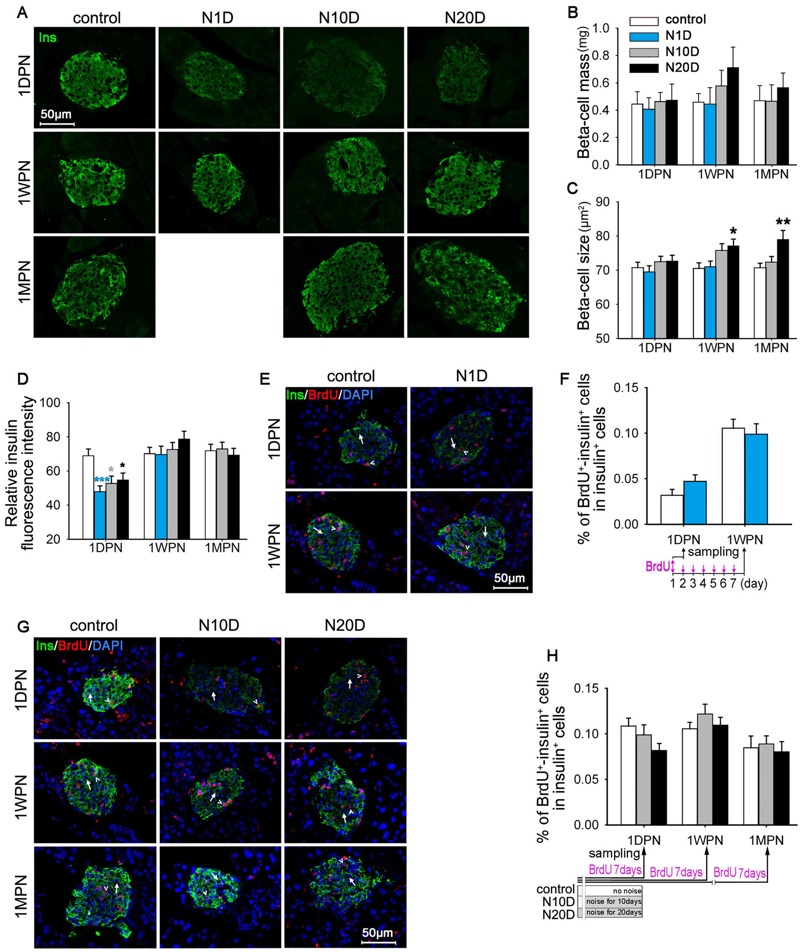
Figure 4.

Effects of noise exposure on β cells in mice. N1D, N10D, and N20D indicate mice that were exposed to 1, 10, and 20 days of noise, respectively; 1DPN, 1WPN, and 1MPN refer to time intervals of 1 day, 1 week, and 1 month after termination of noise exposure, respectively. (A) Representative confocal images of pancreatic sections subjected to insulin (green) immunofluorescence staining. (B–D) Bar graph showing the β-cell mass (B), β-cell size (C), and relative insulin fluorescence intensity in β cells (D) in pancreatic sections. (E) Representative confocal images of pancreatic sections of N1D and age-matched control mice subjected to insulin (green), bromodeoxyuridine (BrdU) (red), and 4′,6-diamidino-2-phenylindole (DAPI) (blue) immunofluorescence staining. Examples of BrdU–-insulin+ cells are indicated by arrows, examples of BrdU+-insulin+ cells are indicated by arrowheads. (F) Bar graph showing the percentages of BrdU+-insulin+ cells among insulin+ cells in pancreatic sections from the N1D and age-matched control groups. (G) Representative confocal images of pancreatic sections from N10D, N20D, and age-matched control mice subjected to insulin (green), BrdU (red), and DAPI (blue) immunofluorescence staining. Examples of BrdU–-insulin+ cells are indicated by arrows, examples of BrdU+-insulin+ cells are indicated by arrowheads. (H) Bar graph showing the percentages of BrdU+-insulin+ cells among insulin+ cells in pancreatic sections from the N10D, N20D, and age-matched control groups. The timelines for BrdU below the x-axes of panels (F) and (H) showing the BrdU infusion protocols employed in corresponding studies. BrdU was administered twice daily for 7 successive days before the pancreases were harvested at the end time points (F,H), except for the N1D group, to which BrdU was given only for 1 day before they were killed at 1DPN (F). All images were captued using a 40× objective. The values are presented as the means ± SEM of 8 mice per group. *p < 0.05, **p < 0.01 and ***p < 0.001 in post-hoc comparisons between each noise group and the control group after one-way analysis of variance (ANOVA), showing a significant effect of noise. To correct for variance nonnormality, the data were log10 transformed for statistical analysis [panels (C,D,F,H)].
