
Figure 2.
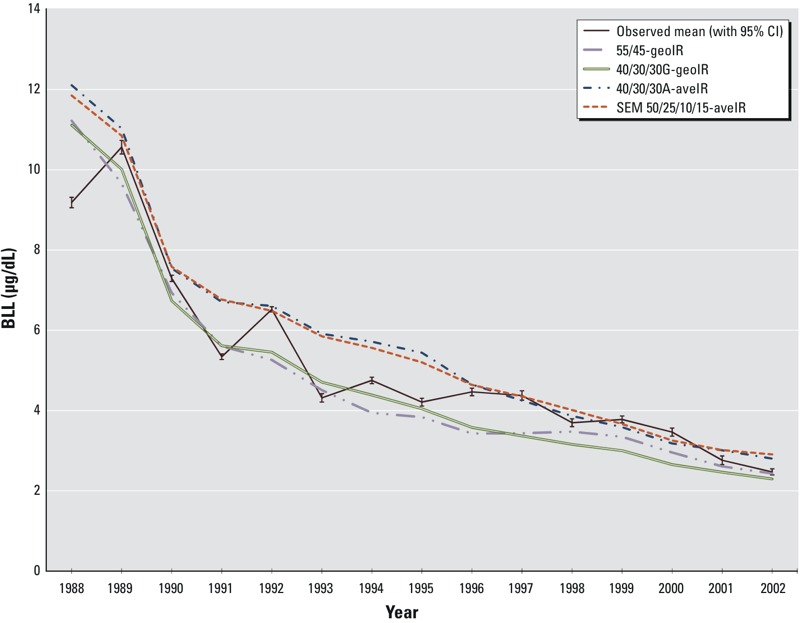
Observed and predicted geometric mean blood lead levels (BLLs) by year for four scenarios that best predict observed BLLs. Predicted geometric mean BLLs for the four scenarios are compared with observed BLLs from 1988 through 2002. Observed BLLs include error bars for the 95% confidence interval (CI). Abbreviations: aveIR, arithmetic mean ingestion rate; geoIR, geometric mean ingestion rate. 55/45 is the partition of dust/yard soil, 40/30/30 is the partition of dust/yard/community soil, and SEM 50/25/10/15 is the partition of dust/yard/neighborhood/community soil. Corresponding numeric data, with 95% CI and percentile distributions for each model and age, are provided in Table S1.