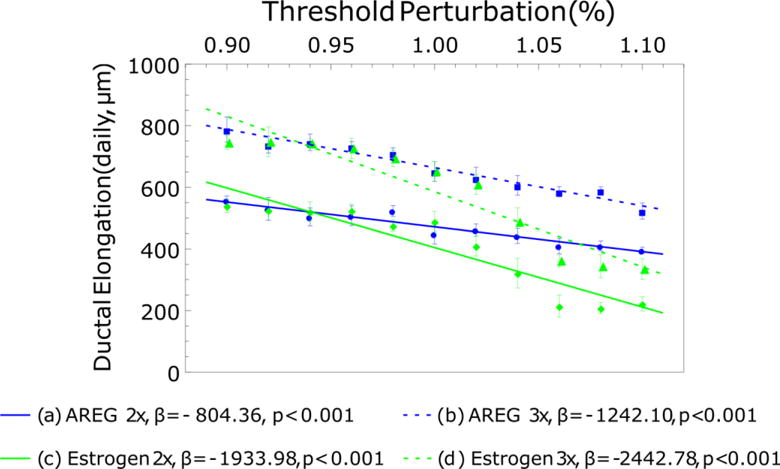
Figure 8.

Effects of independent ±10% signaling threshold variation on ductal elongation rates. AREG restricted growth (a, b) shows reduced daily elongation reduction relative to estrogen restricted ductal elongation. Estrogen restricted growth resulted in more than twice the ductal elongation reduction relative to the AREG restricted case. Each data point represents the mean of 5 simulations with standard deviations; linear best-fit curves are shown as dashed lines. β: the slope of a regression line.
