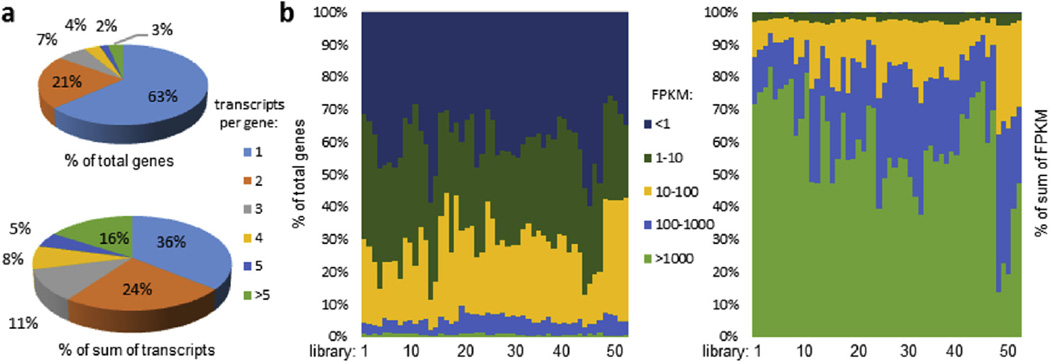
Fig. 3.
Overview of gene transcripts and their relative levels in the 52 cDNA libraries. (a) Distribution of genes and their transcripts based on splicing variants per gene; (b) Percentages of OGS2.0 genes (left) and sums of their FPKM values (right) in the five FPKM categories. The 52 libraries are in the same order as described in He et al. (2015).

