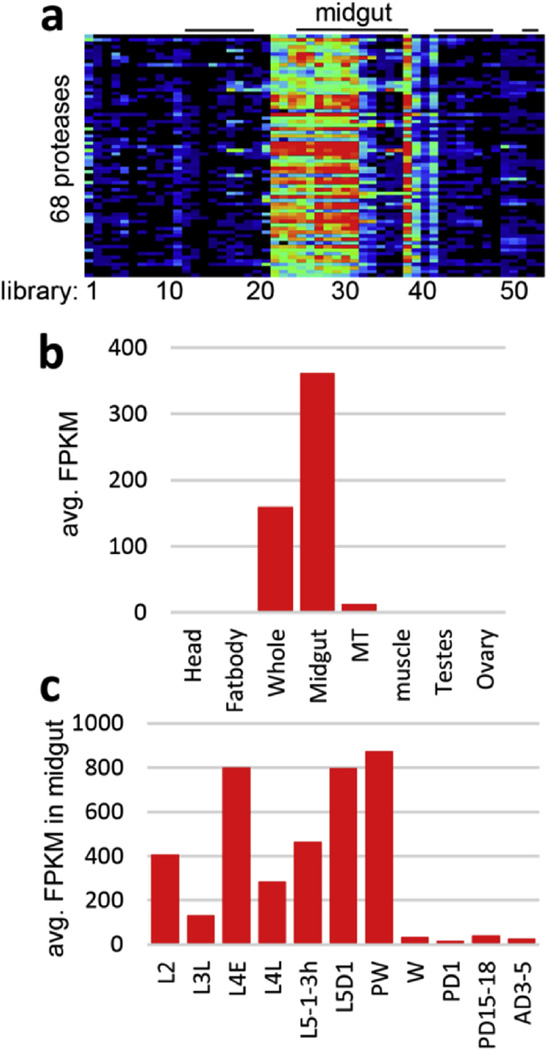
Fig. 4.
Gene expression of 68 gut serine proteases and their close homologs in various tissue samples. (a) The mRNA levels, as represented by log2(FPKM +1) values, are shown in the gradient heat map from blue (0) to red (≥10) (Cao et al., 2015c); (b) Average FPKM values in whole body, Malpighian tubules (MT), and other tissues; (c) stage-dependent transcription in midgut tissues from 2nd instar larvae (L2), late 3rd instar (L3L), early (L4E) and late (L4L) 4th instar, 1–3 h, day 1, pre-wandering (PW) and wandering (W) 5th instar larvae, day 1 and days 15–18 pupae, and days 3–5 adults. (For interpretation of the references to colour in this figure legend, the reader is referred to the web version of this article.)

