
Figure 2. The expression of OGG1 diminishes in macrophages in atherosclerotic lesions overtime.
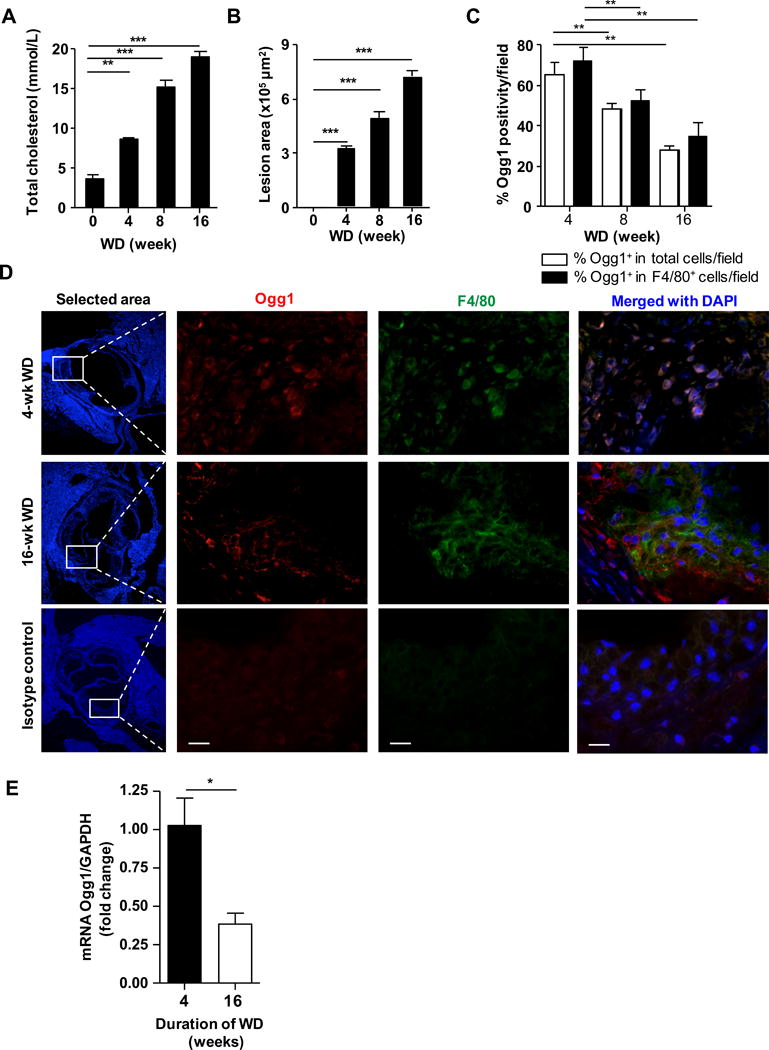
Ldlr−/− mice fed western diet for 0, 4, 8 or 16 weeks (n=6 per group). (A) Total plasma cholesterol concentrations. All data are mean±SD and each sample in duplicate. (B) Quantification of aortic root plaque area. (C) Quantification of OGG1+ cells within aortic root plaque as measured by immunofluorescence. (D) Representative images of immunofluorescent staining for OGG1 in aortic root plaques. Macrophage marker F4/80 (green), Nuclei (blue) and OGG1 (red). Magnification 40×. Scale bar = 20 μm. (E) Expression of Ogg1 mRNA in plaque F4/80+ macrophages isolated by laser-capture microdissection and analyzed by qRT-PCR. All data are mean±SD and representative of 2 independent experiments in triplicate. Significance was determined using One-Way ANOVA with Tukey’s post-hoc test. *p<0.05, **p<0.01, ***p<0.001.