
Figure 5. Plasma levels of cytokines and chemokines.
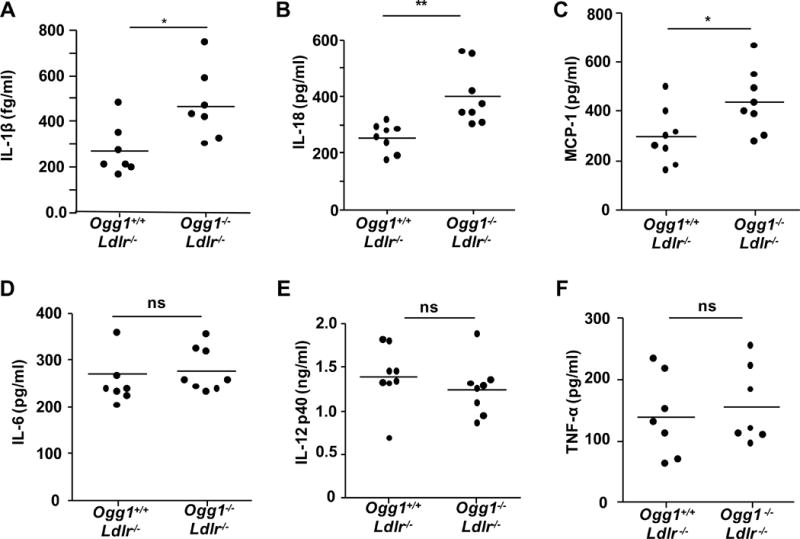
(A–D) Plasma concentrations of IL-1β measured by MSD and IL-18, MCP-1, IL-6, IL-12p40 and TNF-α were detected by ELISA (n=7–8). All data are expressed as mean±SD and performed in triplicate. Student’s t-test was used *p<0.05. ns= not significant.