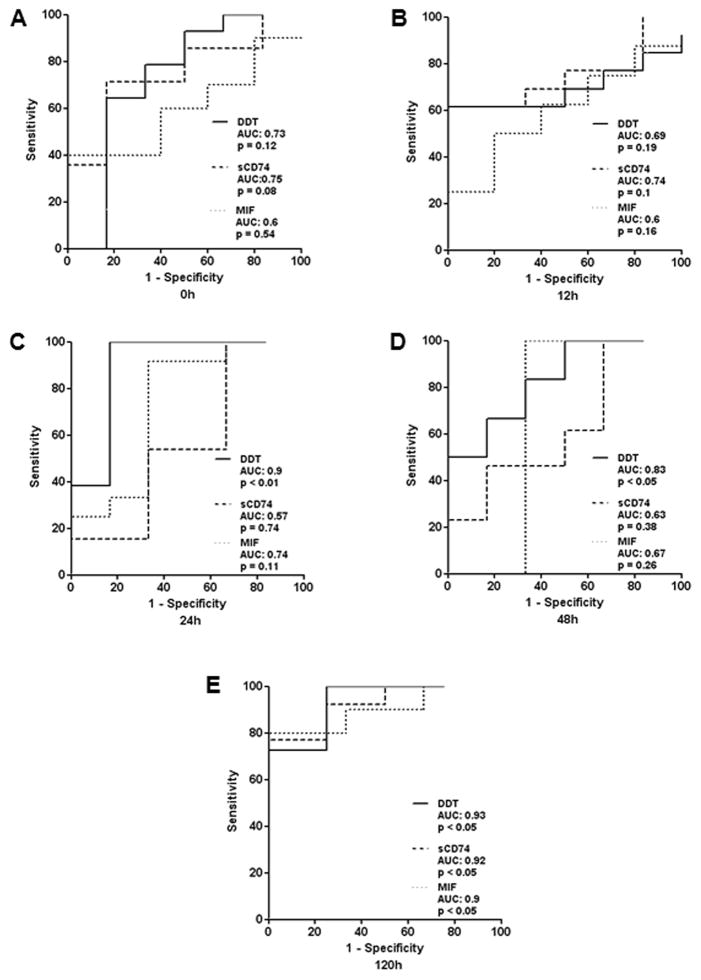
Fig. 6. Predictive value of DDT and sCD74.
The predictive character of DDT and sCD74 serum levels was calculated by ROC curve analysis at the five different time points. For each curve, AUC and p-values are illustrated. Significant AUC curves for DDT are found at 24h, 48h, and 120h, whereas the only significant AUC curve for sCD74 was observed at 120h. A AUC curve at 0h. B AUC curve at 12h. C AUC curve at 24h. D AUC curve at 48h. E AUC curve at 120h. ROC – receiver operating characteristics; AUC – area under the curve

