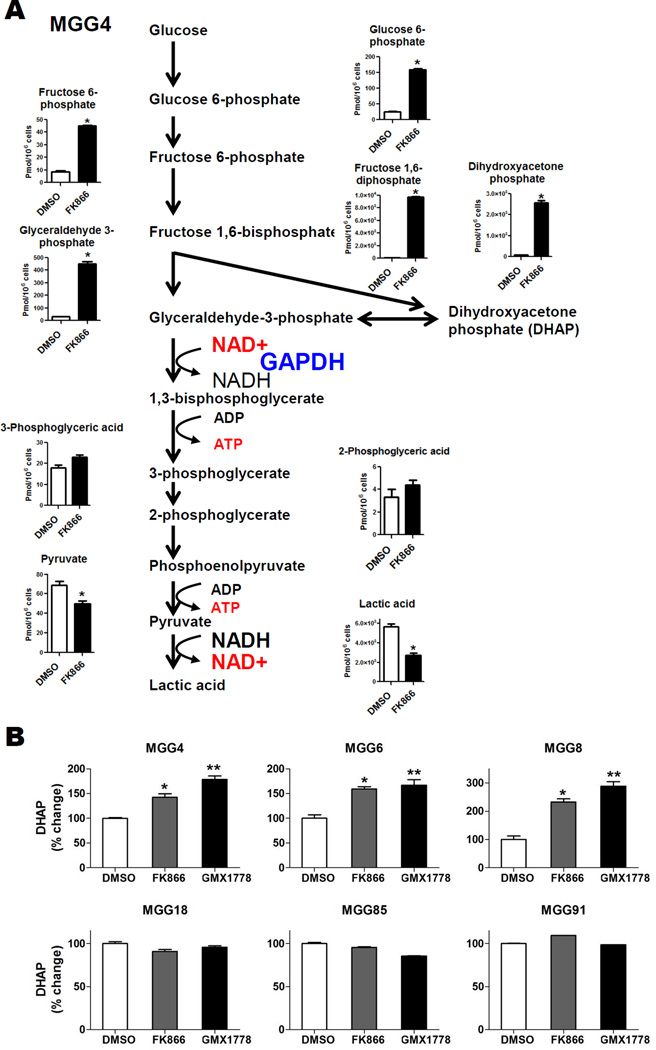
Figure 4. NAMPT Inhibitors Attenuate Glycolysis in MYC/MYCN amplified GBM Tumorspheres.
A, Capillary Electrophoresis Time-of-Flight Mass Spectrometry (CE-TOFMS) analysis of MGG4 cells demonstrating total levels of glycolytic metabolites upstream and downstream of GAPDH after DMSO (48hr, white bars) or FK866 (50nM, 48hr, black bars) treatment. Data were expressed as pmol/1×106 cells. *, P<0.05, Welch’s t-test. B, Dihydroxyacetone phosphate (DHAP) levels in MYC or MYCN amplified (MGG4, 6, 8, upper panels) and MYC/MYCN non-amplified GBM tumorspheres (MGG18, 85, 91, lower panels) treated with DMSO (white bars, 48 hrs) or FK866 (12.5 nM, 48 hrs, gray bars), or GMX1778 (12.5nM, 48hrs, black bars). *, P<0.05 for difference between DMSO and FK866. **, P<0.05 for difference between DMSO and GMX1778. Bars, SE.

