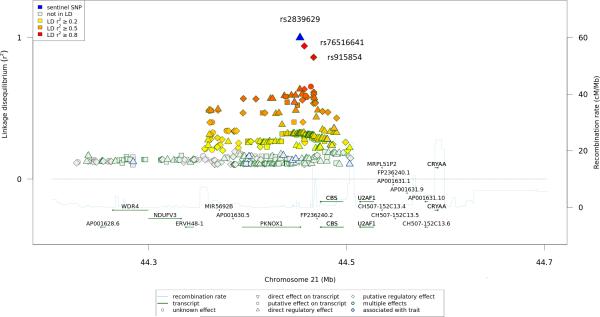
Figure 1.
21q22.3 locus showing genome-wide level of evidence of BiPN in MM. Illustration of the locus with the local linkage disequilibrium and recombination rate over 500-kb centred on rs2839629 (blue triangle). Each diamond, triangle, circle or square represents a SNP found in this locus, rs76516641 and rs915854 are indicated (red diamond). The figure was generated using the web-based tool SNiPA (http://www.snipa.org; 22).

