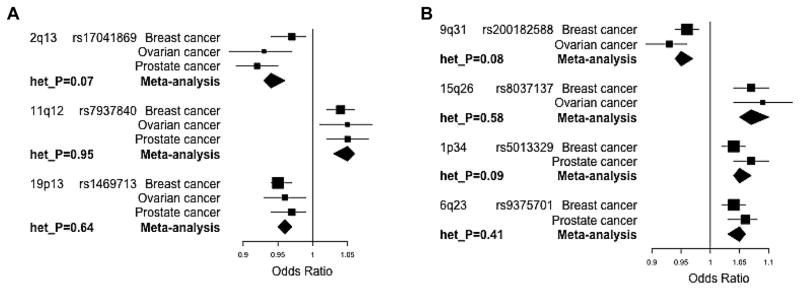
Figure 2.
Forest plots of odds ratio estimates for the new cross-cancer index SNPs (> 1 Mb from known index SNPs) for susceptibility to (A) breast, ovarian, and prostate cancer and (B) breast and ovarian cancer, and breast and prostate cancer. Error bars indicate 95% confidence intervals and het_P is the P-value calculated from Cochran’s Q-test for heterogeneity.

