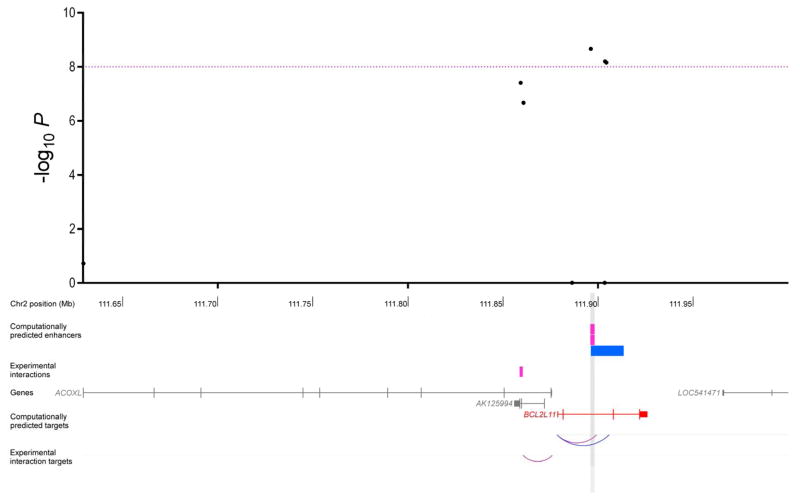
Figure 4.
Regional association plot of results from the three-cancer meta-analysis for the rs17041869/2q13 breast, ovarian, and prostate cancer susceptibility locus. The black dots represent all variants nominally associated (P < 0.05) with every cancer type individually that had the same direction of effect across all three cancers. The purple dashed line corresponds to a threshold of P = 10−8. Tracks immediately below the regional association plot show the locations of enhancers in breast (pink), ovarian (green), and prostate (blue) cell types. Interactions derived from ChIA-PET experiments, which have only been assayed in breast cells, are labeled as experimental interactions. Where the same gene is predicted to be a target of enhancers that intersect with the same P < 10−8 SNP in all three cell types (or two for the 2q13 region), it is shown in red. All other genes in the region are in gray. The corresponding P < 10−8 SNP locations are marked by grey vertical stripes. The lower tracks show arcs between enhancers and target genes for both computationally predicted and experimentally derived interactions. Arc colors reflect the cell type in which the enhancer-promoter pair was identified.

