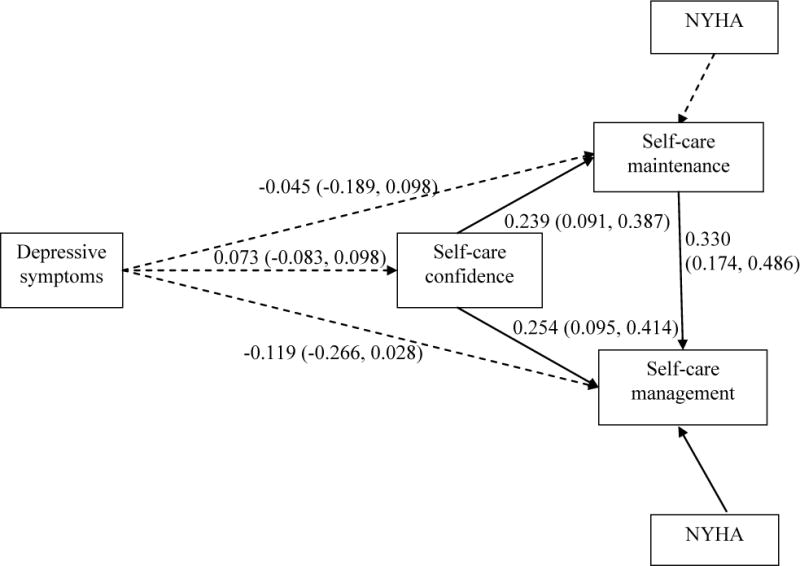
Figure 3.

Path model with patients living with someone (n=153)
Note. Solid lines indicate significant paths dotted lines indicate insignificant paths. Values are standardized coefficients (95% confidence interval).
Model fit indices: X2 = 51.500 (df = 9, p value < 0.001), Comparative Fit Index = 1.000, Standardized Root Mean Square Residual <0.0001.
NYHA= New York Heart Association functional class
