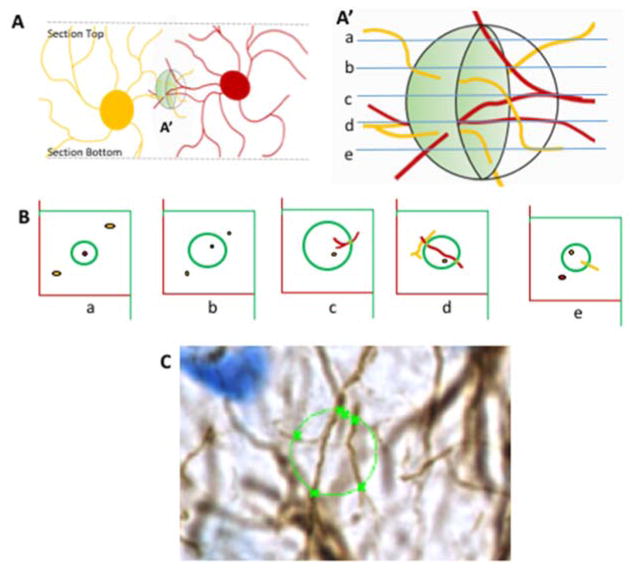
Figure 5. Schematic representing the use of Isotropic sphere (spaceball) probe for fiberlength analysis.
A) View through the Z axis of a section with two astrocytes represented. The virtual sphere (spaceball) is in the shaded region A′. A′) Enlargement of the virtual spaceball sphere with optical sections (a–e) to analyze the fibers as they cross the perimeter of the sphere at that level. B) Images of each optical plane along the z-axis of the sphere. At any given plane, fibers are only counted if they are in focus as they traverse the perimeter of an optical Z plane. At plane d, the red astrocyte fiber is long enough to traverse the perimeter of the sphere twice, whereas the yellow astrocyte does not cross at that plane; therefore 2 instances are counted. C) Image of one of the sections of the specimen used in this study. The x represents where in-focus fibers cross the perimeter of the optical plane (circle) of the space ball probe which was 10μm in diameter.

