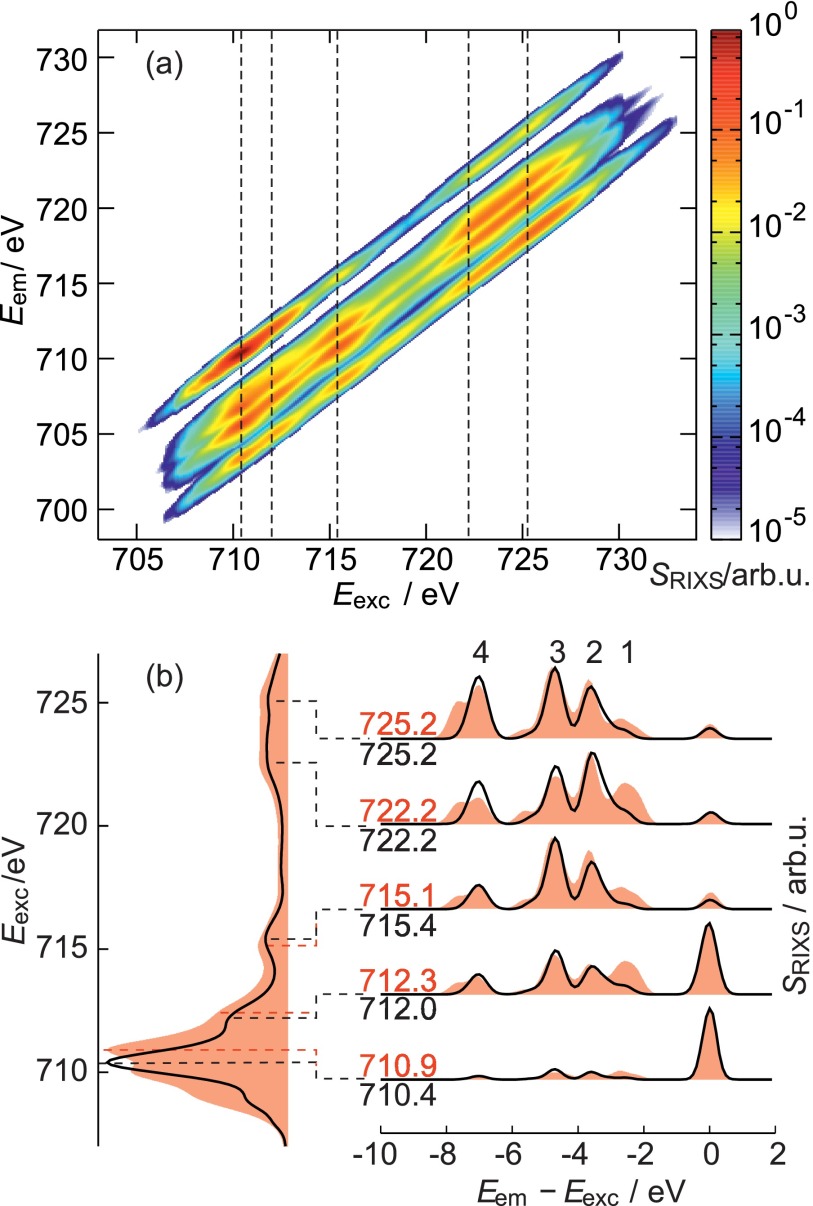
FIG. 4.
(a) 2D RIXS spectrum of [Heme B–Cl]0; (b) Left panel: normalized XAS for [Heme B–Cl]0 (black) and [Heme B–H2O]+ (red filled curves). Right panel: normalized 1D-RIXS spectra for selected excitation energies that are specified by the dashed lines and numbers. The peaks labeled 1–4 are discussed in the text.

