
Figure 1.
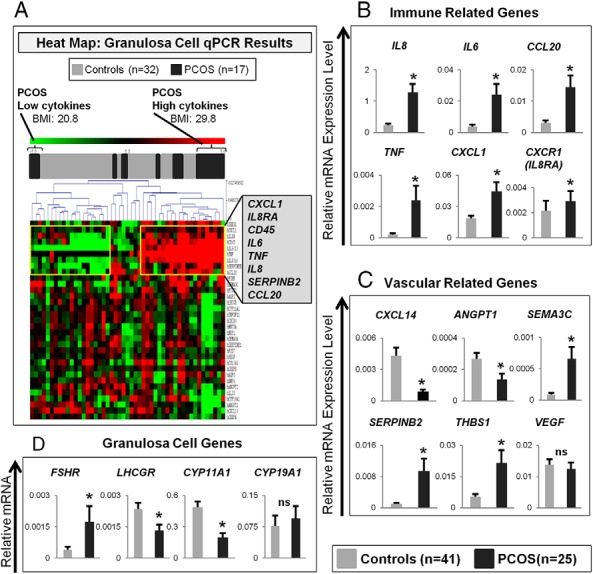
A, Heat map of relative qPCR results. B–D, Relative mRNA expression of genes in luteinized granulosa cell collections of control compared with PCOS women. B, Immune-related genes. C, Vascular-related genes. D, Genes specific to granulosa cells. Statistical comparisons were made with the Mann-Whitney test. *, P < .05. ns, not significant.