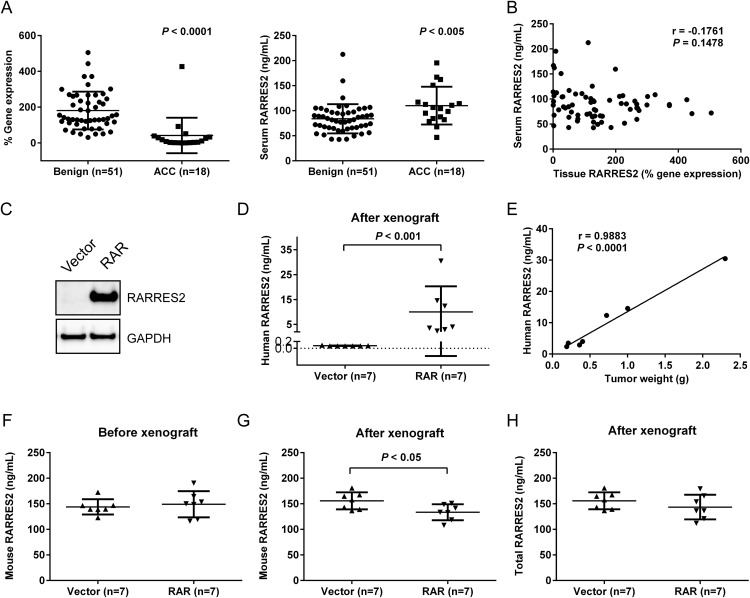
Figure 3.
Elevated serum RARRES2 levels observed in patients do not come from tumors expressing low RARRES2. A, Pair-matched analysis for tissue RARRES2 (left) and serum RARRES2 (right) levels from 51 patients with benign adrenocortical tumors and 18 patients with ACC. B, Tissue RARRES2 expression has no significant correlation with the serum RARRES2 level from the same patients. r, correlation coefficient. Pair-matched tissue and serum RARRES2 levels from 51 benign adrenocortical tumors and 18 ACC samples were examined. % gene expression = 2 −Δ(Ct RARRES2 − Ct GAPDH) × 100. C, Representative Western blot showing the difference in the RARRES2 protein level in stable H295R cells overexpressing RARRES2 (RAR) as compared with stable H295R cells overexpressing an empty vector. The stable cell lines were used in mouse xenografts. D, The human RARRES2 level increased significantly in mouse serum when the mice were xenografted with stable RARRES2 overexpressing H295R cells. E, The human RARRES2 level in mouse serum correlated significantly with tumor weight. F, Mouse serum RARRES2 levels before the xenograft experiment. No significant difference was observed. G, Mouse serum RARRES2 levels after the xenograft experiment. Mice xenografted with RARRES2-overexpressing ACC cells showed significantly decreased mouse RARRES2 levels. H, Total (mouse and human) RARRES2 levels in mouse serum after the xenograft experiment. No significant difference was observed between the groups.

