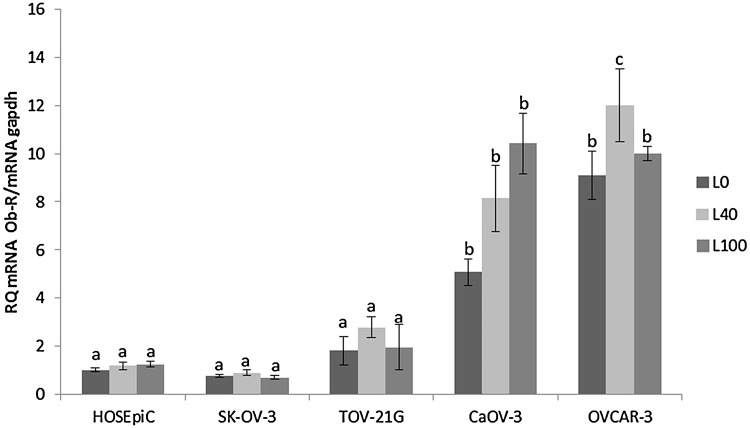
Fig. 2.
Effect of leptin on the expression of leptin receptor (ObR) gene in different cell lines. Each point represents the mean ± SEM from three independent experiments. Statistically significant different from control are indicated with different letters; the same letters indicating no significant differences, with a < b < c

