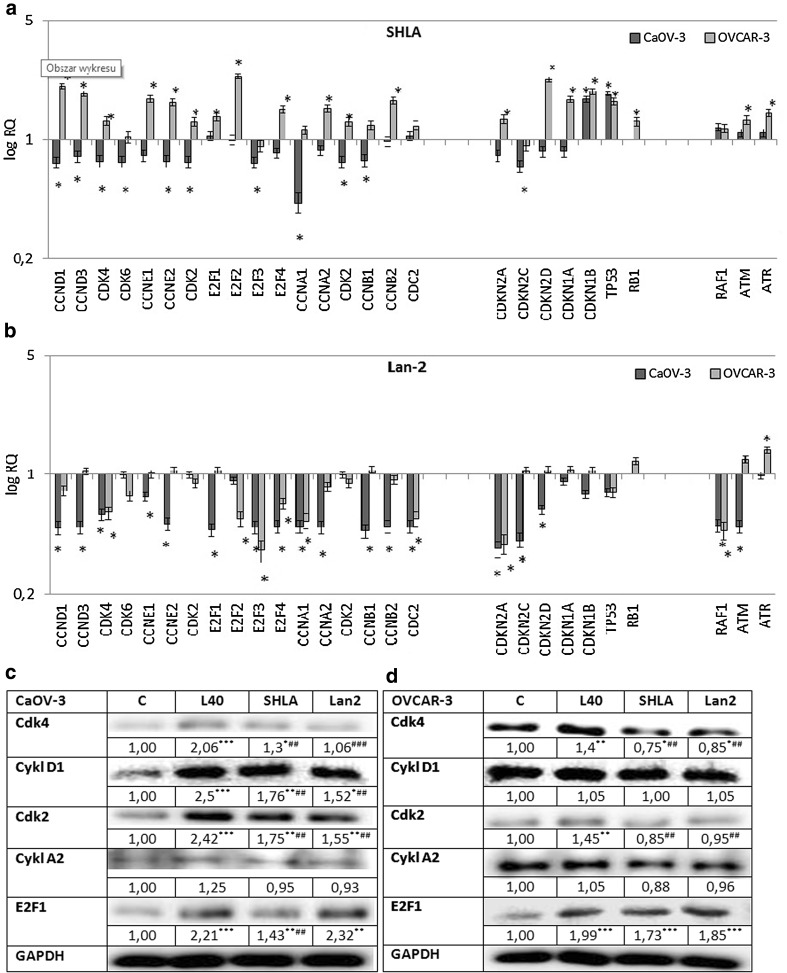
Fig. 5.
Changes in selected cell cycle genes expression in CaOV-3 and OVCAR-3 cells exposed to SHLA (a) and Lan-2 (b) at dose 1000 ng/mL with leptin at dose 40 ng/mL for 24 h. All values marked with *(p < 0.05) are significantly different from leptin treated (40 ng/mL) control. Control value = 1.0. The effect of SHLA and Lan-2 at dose 1000 ng/mL with leptin at dose 40 ng/mL on cdk2, cyclin A, cdk4, cyclin D and E2F1 protein expression in CaOV-3 (c) and OVCAR-3 (d) cells. GAPDH was used as a loading control for Western blot analysis. The representative blots of three experiments are shown in the panels. Cdk2, cyclin A, cdk4, cyclin D and E2F1 densitometry results were normalised to GAPDH loading controls to obtain a ratio bands. Values are mean ± SEM All values marked with *(p < 0.05), **(p < 0.01) and ***(p < 0.001) are significantly different from untreated control values. All values marked with #(p < 0.05), ##(p < 0.01) and ###(p < 0.001) are significantly different from values of leptin at dose 40 ng/mL

