Fig. 1.

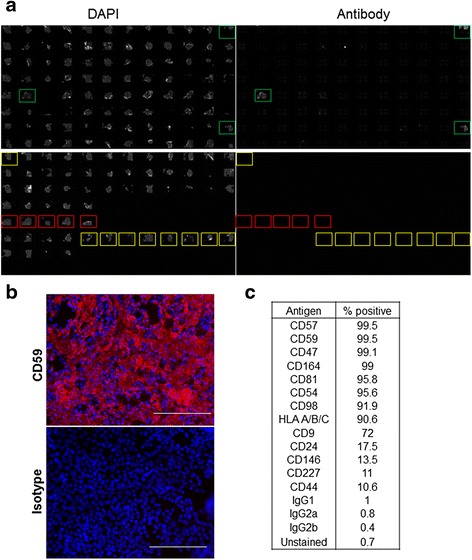
Screening for cell surface markers expressed on RPE cells. a Representative image showing results of screening for identification of cell surface markers expressed on RPE. Overview of DAPI (left) and antibody (right) specific staining in a 384-well plate. Green boxes indicate positive staining with a cell surface marker, red boxes indicate isotype controls and yellow boxes indicate unstained cells. b Representative image showing a magnified view of a well staining positive with an antibody against CD59 (red) compared with background staining using isotype control. Nuclei are stained with DAPI (blue). Scale bar = 150 μm. c % positive expression of indicated antigen in RPE cells as determined by flow cytometry. DAPI 4′,6-diamidino-2-phenylindole (Colour figure online)
