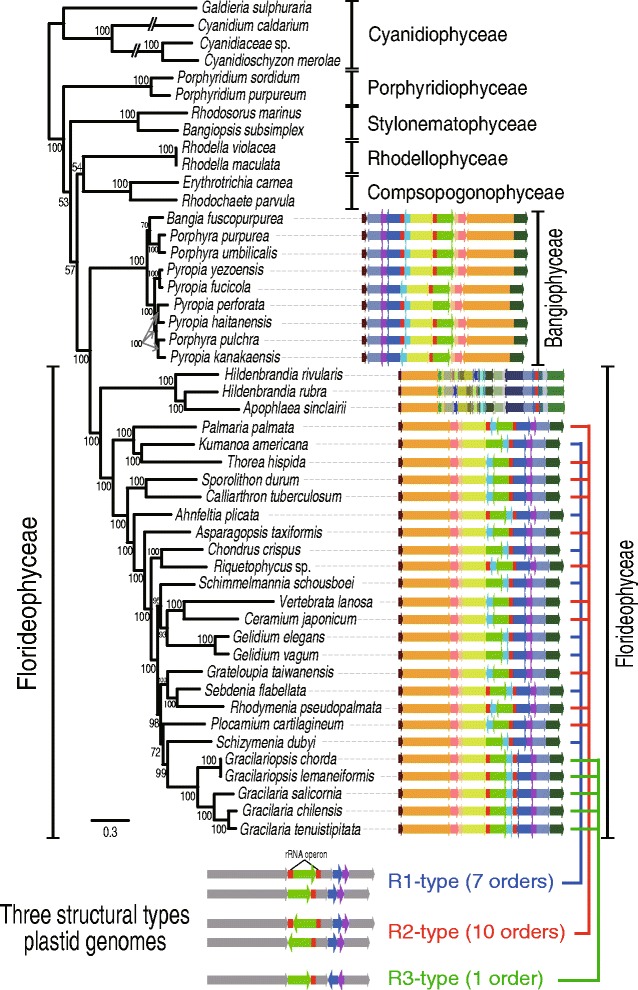
Fig. 1.

Red algal plastid genomes in the class Florideophyceae. In this synteny analysis of R1-type (seven orders), R2-type (10 orders), and R3-type (one order) structures, conserved color-schemes indicate a homologous plastid region except in the subclass Hildenbrandiophycidae, where synteny is not maintained, although the same color scheme applies. All of the red rectangular boxes indicate rDNA operons. Each color indicates a conserved genomic fragment. Under the tree, a simplified synteny image of the three different plastid genome types is shown in which the gray arrows indicate conservation and green, blue, and purple arrows indicate variable regions
