
Figure 1.
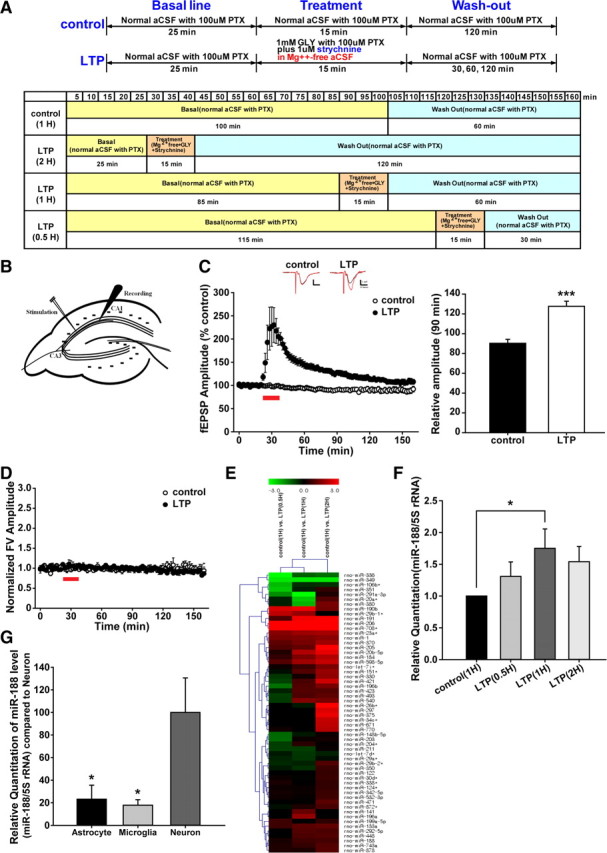
Synaptic activity upregulates miR-188 expression. LTP was introduced in acute hippocampal slices by treatment with 1 mm glycine (GLY), 1 μm strychnine and 100 μm picrotoxin (PTX) in Mg2+-free aCSF (119 mm NaCl, 2.5 mm KCl, 1.25 mm NaH2PO4, 26 mm NaHCO3, 10 mm Glucose, 2.5 mm CaCl2; pH 7.4) at 25°C. A, The experimental scheme for LTP induction is shown. The time points for collecting hippocampal slices for RNA extraction are indicated (control, LTP-0.5 h, LTP-1 h, LTP-2 h). B, A schematic illustration of the Schaffer collateral pathway in the rat hippocampal circuit that was used in the fEPSP recordings. (C, D) fEPSPs were evoked by constant stimulation in the Schaffer collaterals with a bipolar electrode and were recorded in the stratum radiatum layer of CA1 with a glass micropipette filled with 3 m NaCl. The fEPSP amplitudes were increased to 230.11 ± 37.61% (mean ± SEM, n = 7, filled circles, p = 0.0019) by LTP induction, compared with the basal aCSF solution (99.13 ± 1.54%, n = 6, open circles). The potentiated responses slowly decreased, but throughout the recording period, the cells maintained significantly potentiated responses for >60 min (126.90 ± 5.69%, n = 7 in LTP vs 90.35 ± 3.97%, n = 6 in control, ***p = 0.00017). The statistical analysis consisted of an independent t test between the control and LTP groups; the data are represented by the mean ± SEM. E, Microarray screening of miRNAs was conducted to investigate the changes in miRNA expression during LTP using an array chip with 2 sets of independent experiment [each set consisted of control (1 h), chem-LTP (0.5 h), chem-LTP (1 h), chem-LTP (2 h); the cutoff value of upregulation or downregulation is 1.5-fold] at different time points. A heatmap is shown. F, qRT-PCR was performed to examine miR-188 in the rat hippocampal slices after LTP induction. The statistical analysis used a one-way ANOVA with Fisher's least significant difference (LSD) post hoc test; the data are represented by the means ± SEM. G, qRT-PCR was performed to examine miR-188 expression in cultured primary hippocampal neurons, astrocytes, and microglia. The statistical analysis was performed using a one-way ANOVA with LSD post hoc test; the data are represented by the means ± SEM.