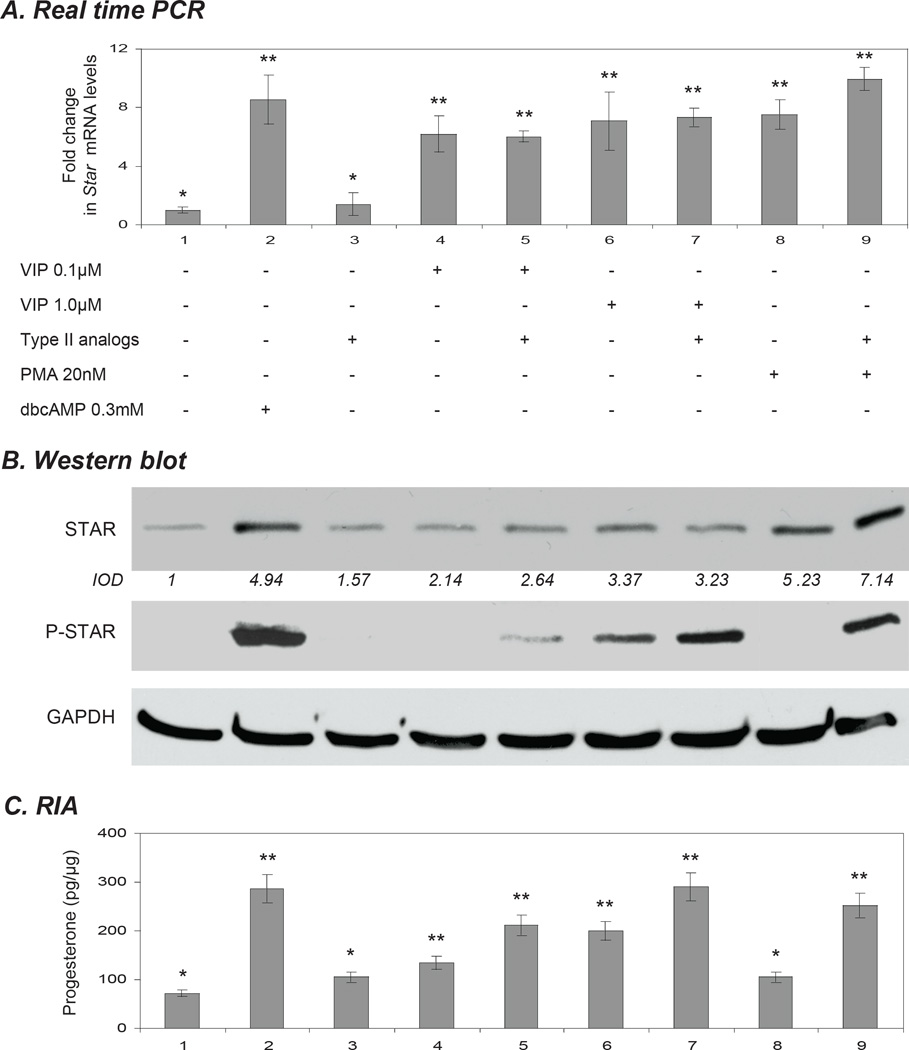
Figure 7.
The induction of STAR phosphorylation in response to vasoactive intestinal peptide (VIP). KK1 cells were treated for 6 h with either 0.1 µM or 1.0 µM VIP with or without type II PKA analogs (25 µm MBC-cAMP together with 100µM PIP-cAMP) and PMA (20 nM). Untreated cells and cells treated with 0.3 mM dbcAMP were used as controls. A) Star mRNA expression as determined by Real Time (TaqMan) PCR normalised against the GAPDH. B) STAR (30kDa), P-STAR (30 kDa) and GAPDH (37 kDa) levels were examined by Western blot analysis. The average integrated optical density (IOD) for STAR, normalized with GAPDH, is shown as fold changes relative to the untreated control. C) Progesterone production was determined by radioimmunoassay. One-way ANOVA with p < 0.0001 (A,C) followed by Dunnett’s multiple comparison test was applied; all samples were compared against the untreated control. Bars with (**) differ at p < 0.01.

