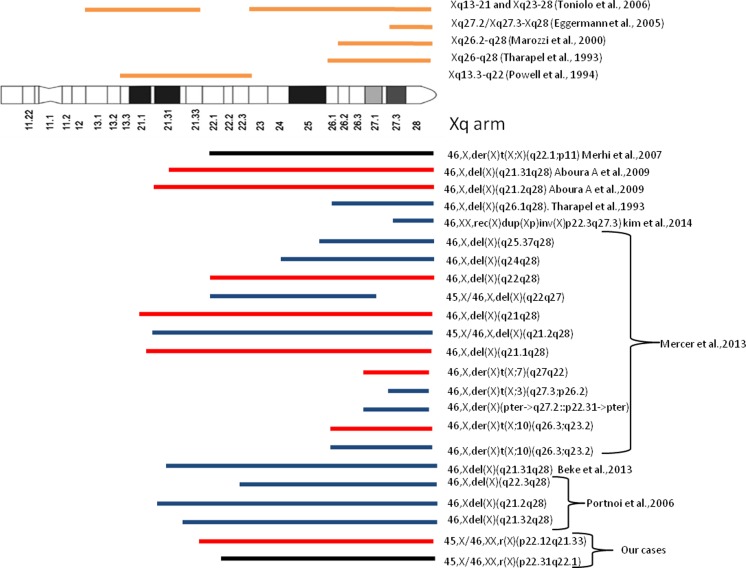
Fig. 4.
Comparative schematic presentation showing portion of Xq material missing in each case and their menstruation pattern (red bar for primary amenorrhoea, black bar for oligoamenorrhoea and blue bar for secondary amenorrhoea) from already published data and in our cases. Above ideogram, bars represent critical regions for ovarian dysgenesis suggested in different studies. Diagram modified from [14]

