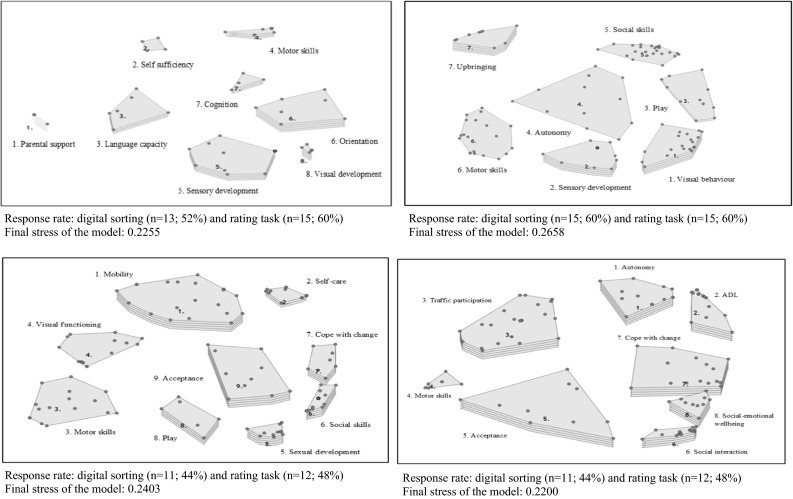
Fig. 1.

Concept-mapping results of life situations affected by a visual disability, according to low vision professionals; from left to right age-band 0–2, 3–6, 7–12 and 13–17. The maps show clusters of items (the dots) that were considered similar in thematic content: more layers indicate greater importance
