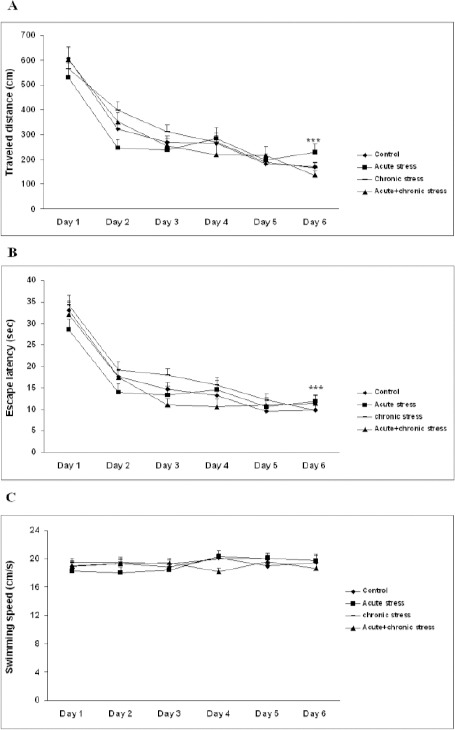
Figure 2.

Traveled distance, average escape latency, and swimming speed during 6-day training in MWM
Average escape latency (A), traveled distance (B), and swimming speed (C) across all training days. As shown the mean latency and traveled distance to find the platform declined progressively in all animals. Analysis showed distance traveled and escape latency on the 6th day of training were statistically different (P< 0.001) from the first day of training. Data is expressed as mean±SEM of 84 animals.
***P< 0.001 versus the first day of training in each group
