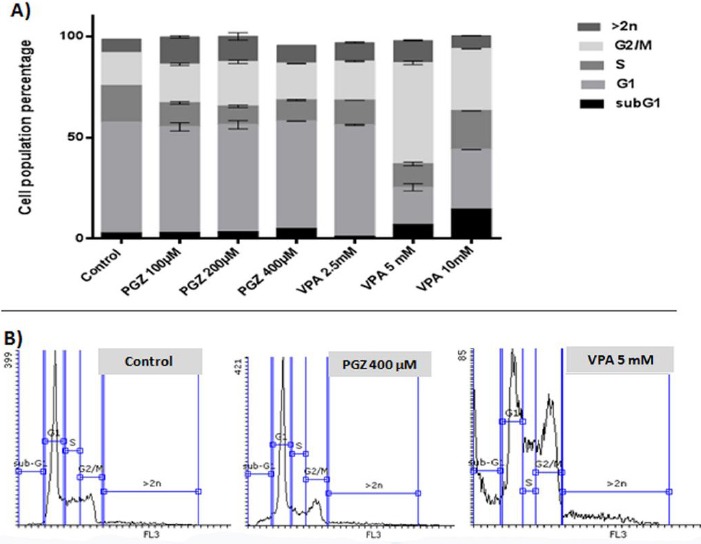
Figure 3.

Cell cycle analysis of treated Jurkat cells. A) Each bar shows the percentage of the cell population in each cell cycle phase proportionally for different groups. B) The histogram flowcytometry graphs for PI stained nucleus of control, PGZ 400 μM, and VPA 5 mM groups are presented as sample
