
Figure 1.
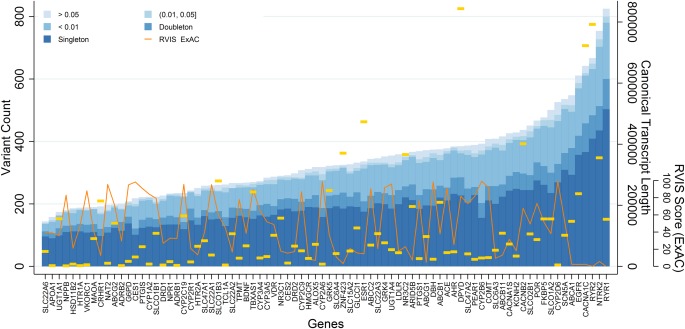
Allelic spectrum of eMERGE‐PGx variants. Counts of genomic variants mapping to the canonical transcript of PGRNseq captured genes are plotted by frequency class (over all samples) by gene (x‐axis) in ascending order. Gold horizontal lines indicate the size of the canonical transcript in basepairs. The inset line plot is a percentile rank of genic intolerance (RVIS) scores computed using the ExAC dataset.