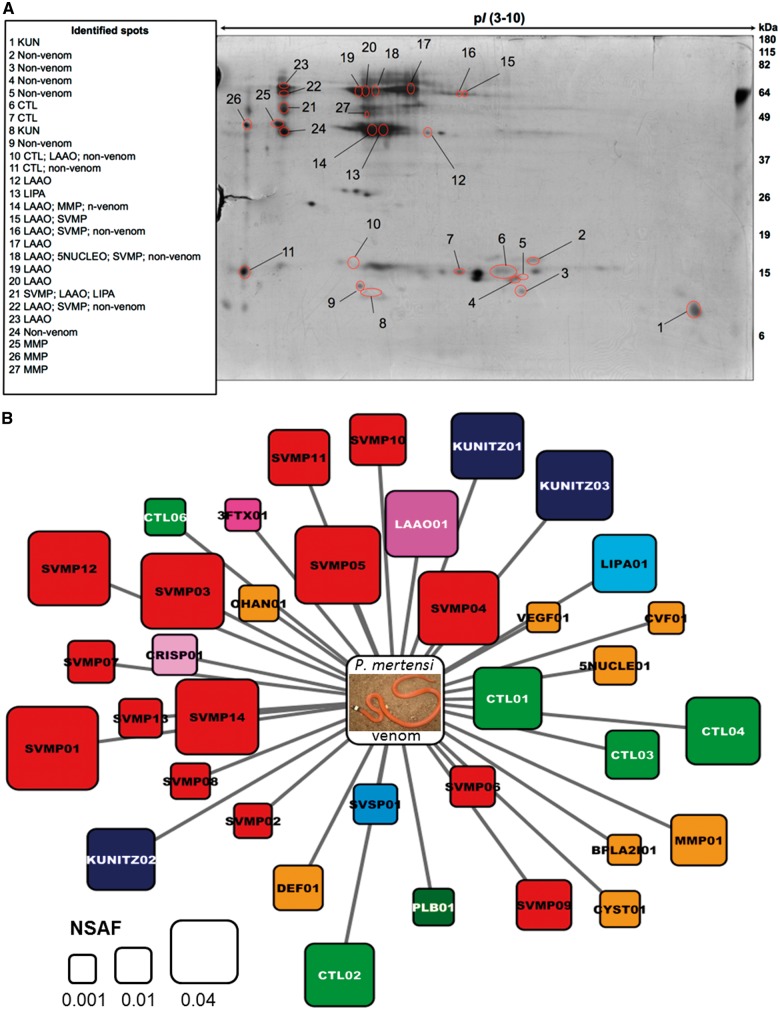
Fig. 3.—
Proteomic analysis of P. mertensi venom. (A) 2-DE profile of P. mertensi venom. Venom (350 µg) was applied to IPG strips (24 cm, pI 3-10) followed by electrophoresis on 12% SDS–polyacrylamide gels (20 cm × 26 cm). Proteins were stained with silver. Protein spots that were selected for in-gel trypsin digestion and LC-MS/MS analysis are indicated with red circles. Left side panel shows identified protein classes. (B) Graphical overview of toxin classes identified in P. mertensi venom by in-solution trypsin digestion followed by LC-MS/MS and label-free quantitative analysis. The area of each square is proportional to the NSAF. Graphical view generated with Cytoscape v. 2.8.1 (Cline et al. 2007).

