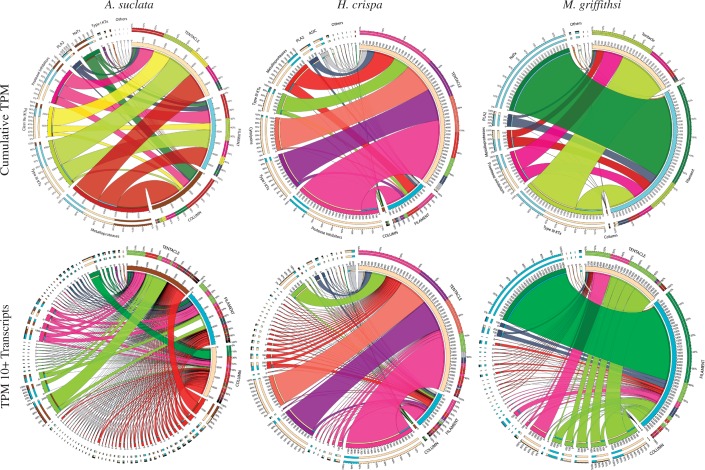
Fig. 2.—
Relative expression of toxin genes across tissues. CIRCOS plots with line thickness depicting both cumulative TPM values (top row) and transcript-specific TPM values (bottom row) for each toxin gene family across focal species and tissues. The tissue of origin is noted in capital letters, with the different toxin genes color coded across all plots. The transcript-specific plots (bottom row) show only transcripts with a TPM value >10 in at least one tissue type.

