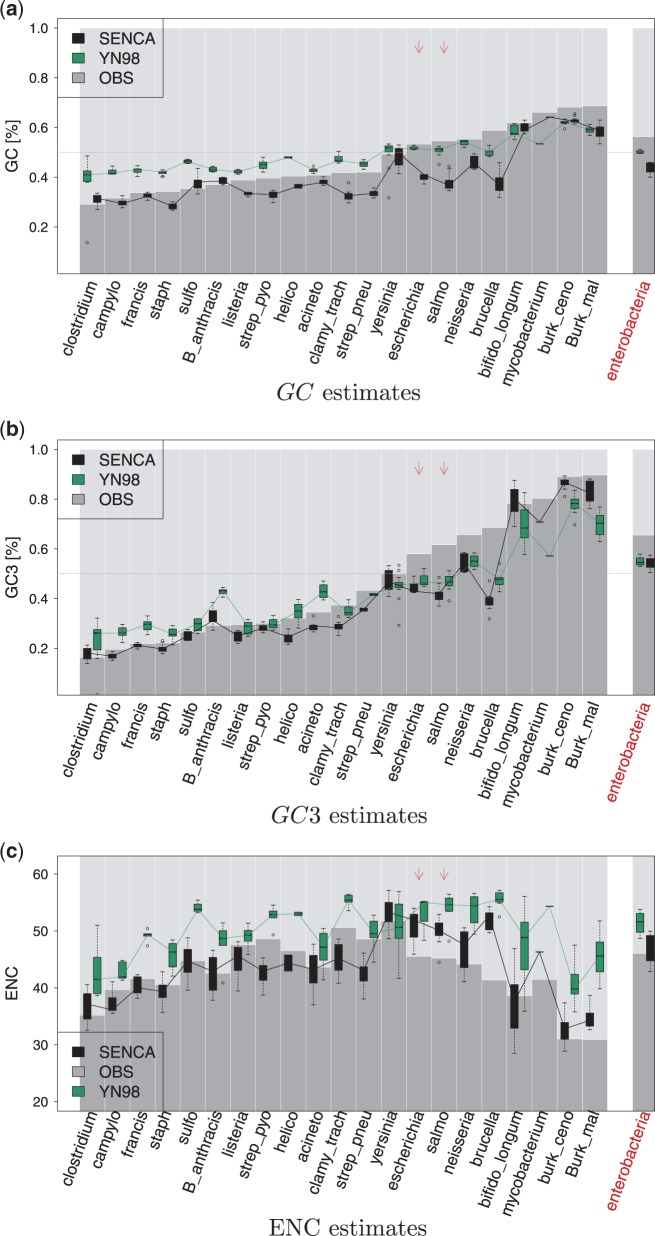
Fig. 3.—
GC, GC3 contents and ENC estimates at equilibrium from SENCA and YN98. Species are ordered by increasing GC content in (a) and (c), and by increasing GC3 in (b). Interspecific results are shown on the right. Gray bars represent observed GC in (a), observed GC3 in (b), and observed ENC in (c). Boxplots span the different concatenates within a species. Black stands for SENCA estimates, green for YN98 estimates. Arrows indicate Escherichia coli and Salmonella enterica.

