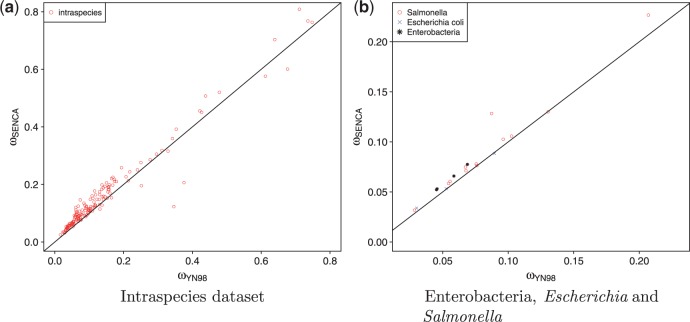
Fig. 4.—
Estimates of ω from SENCA and YN98. The line represents . Estimates of SENCA are significantly higher than those of YN98 (see main text). (a) represents the intraspecies data set and (b) represents in blue Escherichia coli, in red Salmonella enterica, and in black the concatenates from the interspecific data set. Each point is a concatenate.

