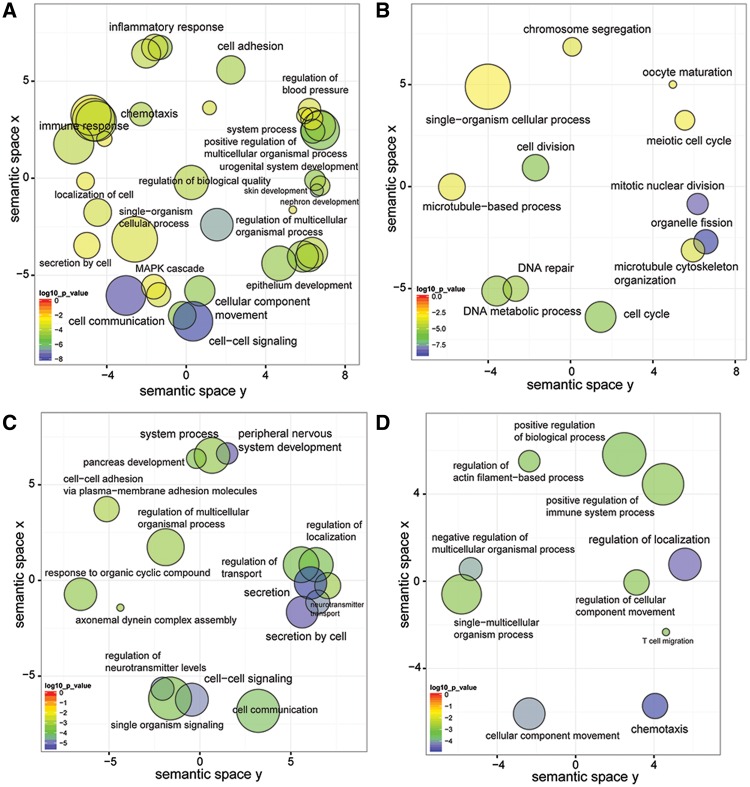
Fig. 6.—
Visualization of biological process GO terms in sematic space by REVIGO. GO terms overrepresented in the list of genes specific to the opossum ESF transcriptome are shown in (A), whereas those overrepresented in the list of genes specific to the ancestral neo-ESF transcriptome are shown in (B). Likewise, GO terms overrepresented in the list of genes present or absent in the cow ESF transcriptome are shown in (C) and (D), respectively. The color of each circle corresponds to log 10 P values according to the color scale shown at the bottom left of each figure. The size of each circle is proportional to the size of GO terms.

