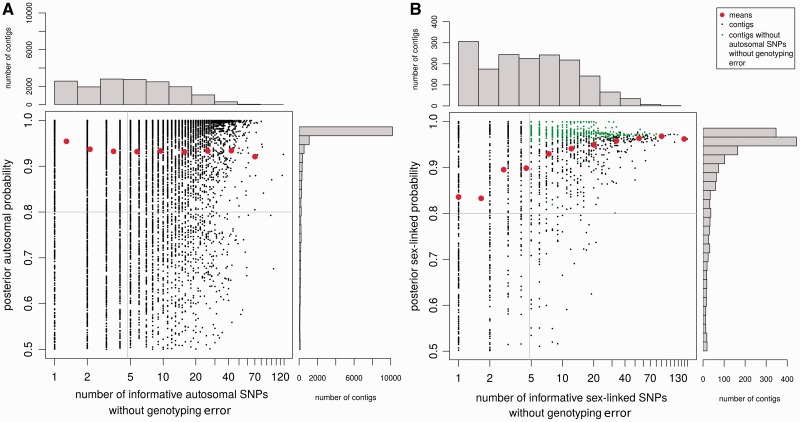
Fig. 5.—
Performance of the method. The number of SNPs without genotyping error was plotted against the posterior segregation type probability for each autosomal (A) and sex-linked (B) contigs of the S. latifolia dataset. The distributions of both variables are shown, and means for each category on the histograms are indicated by red dots. Sex-linked genes that remain after filters that are commonly applied in empirical methods are shown in green (at least five sex-linked SNPs and no autosomal SNPs). SEX-DETector on the other hand filters for a posterior probability above 0.8 (horizontal line on graph) and at least one sex-linked SNP, so that more contigs can be inferred as sex-linked, without increasing the false positive rate compared with other empirical methods (fig. 4).

