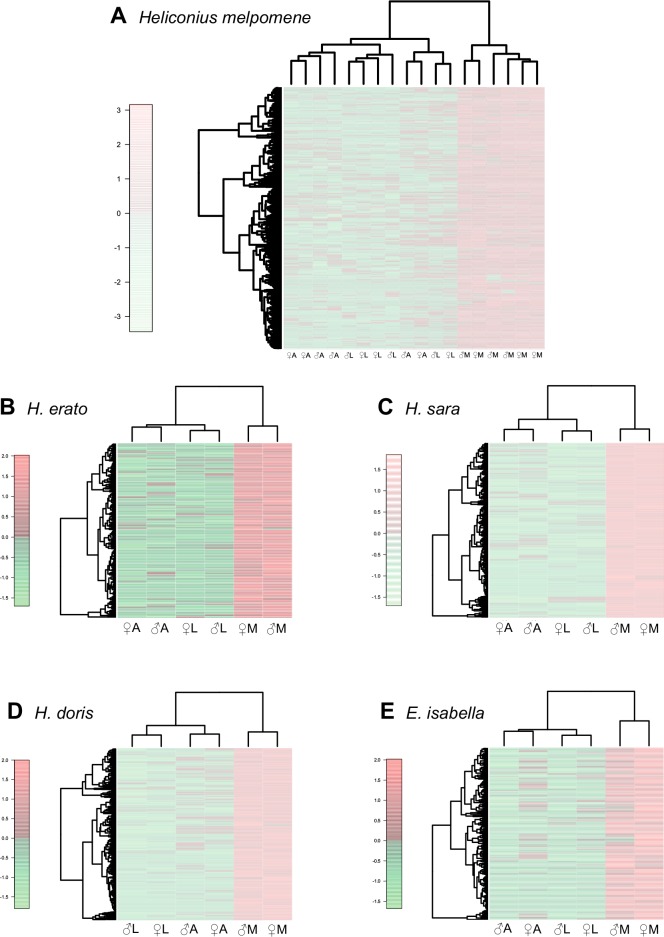
Fig. 2.—.
Heatmaps of significantly upregulated contigs in the mouthparts of each species (FDR < 0.05, logFC of > 1). Color scale indicates the scaled log counts-per-million expression difference between libraries, with each row being a contig. (A) H. melpomene, (B) H. erato, (C) H. sara, (D) H. doris, (E) E. isabella. A = antennae, L = legs, M = mouthparts.

