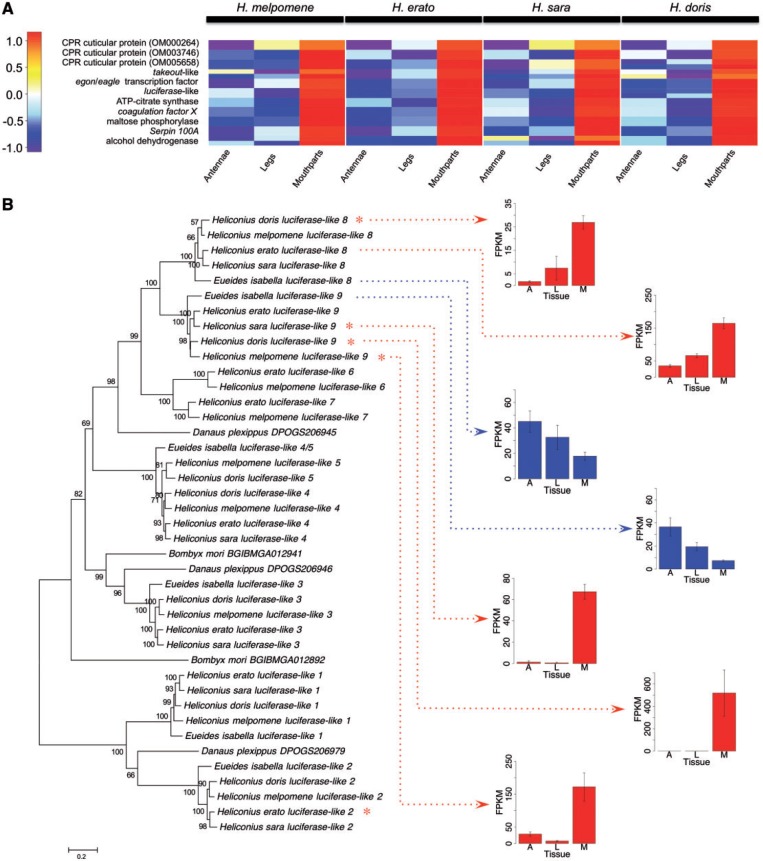
Fig. 5.—
Average expression levels of genes upregulated in Heliconius mouthparts and luciferase-like gene family phylogeny. (A) Color bar is the scaled log counts-per-million difference between tissues. Multiple homologs from a single orthocluster are presented as half-size boxes in the same row. Genes are also listed in table 4. (B) Maximum-likelihood tree of luciferase-like genes including bootstrap support values (above branches; < 50% values not shown) and branch length scale bar (substitutions per site). Red asterisks indicate genes significantly upregulated in mouthparts (FDR < 0.05, logFC > 1). H. erato luciferase-like 8 did not reach this threshold. Mean and standard error of gene expression (FPKM) for luciferase-like 8 and 9 are shown (Heliconius genes in red, E. isabella in blue). FPKM was normalized between species (to H. melpomene) using a normalization factor derived from a highly and stably expressed reference gene (Drosophila ortholog cryptocephal). A = antennae, L = legs and M = mouthparts.

