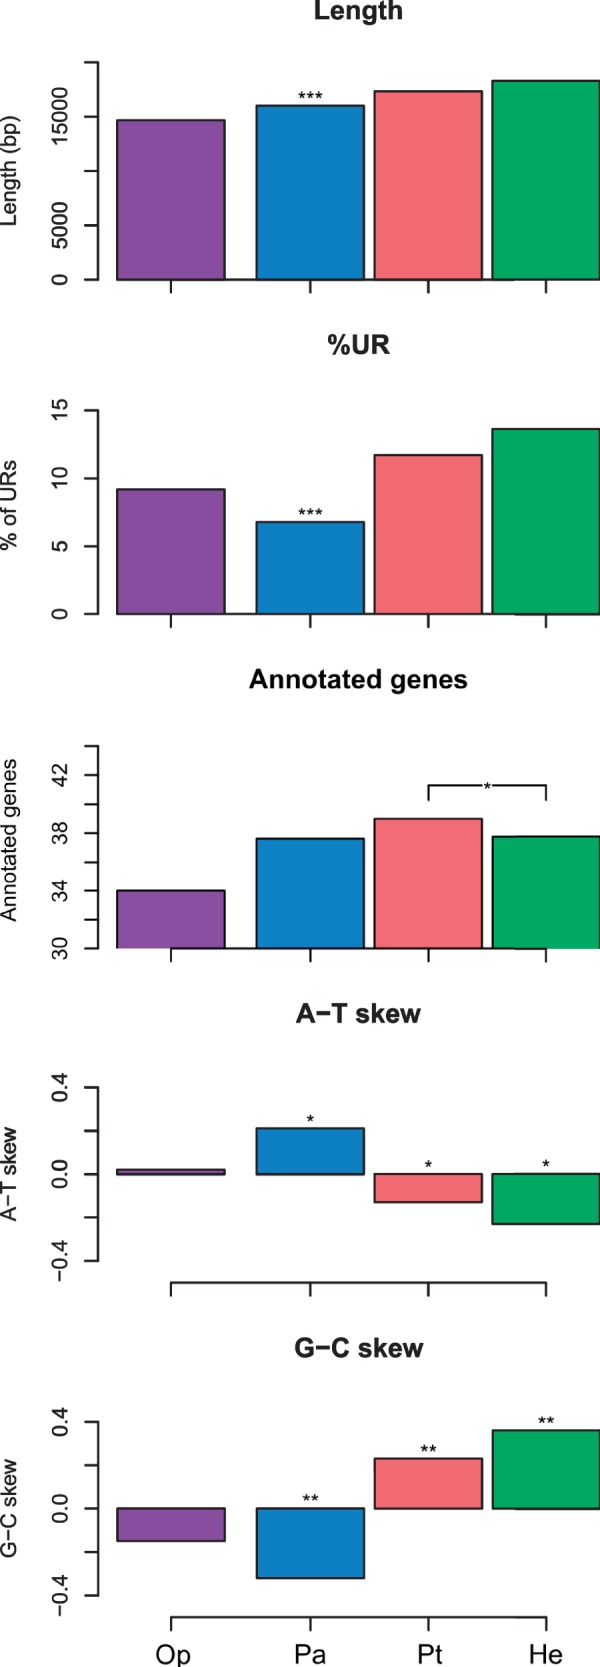
Fig. 1.—

Main features of mitochondrial genomes. Five large-scale mitochondrial features are compared across four bivalvian subclasses (the fifth subclass, Anomalodesmata, was excluded because only one mitogenome was available): Op, Opponobranchia (purple); Pa, Palaeoheterodonta (blue); Pt, Pteriomorphia (red); He, Heterodonta (green). Length, median length of the genome; %UR, median percentage of Untranslated Regions; Annotated genes, mean number of annotated genes; A-T skew, median A-T skew; G-C skew, median G-C skew. Differences between subclasses were tested using the Krukal–Wallis and the Dunn's test; Anomaldesmata and Opponobranchia were excluded because of low sample size (N = 1 and N = 2, respectively). Asterisks above columns refer to levels of significance in both pairwise comparisons or in a single one (bracketed); *P < 0.05; **P < 0.01, ***P < 0.001.
