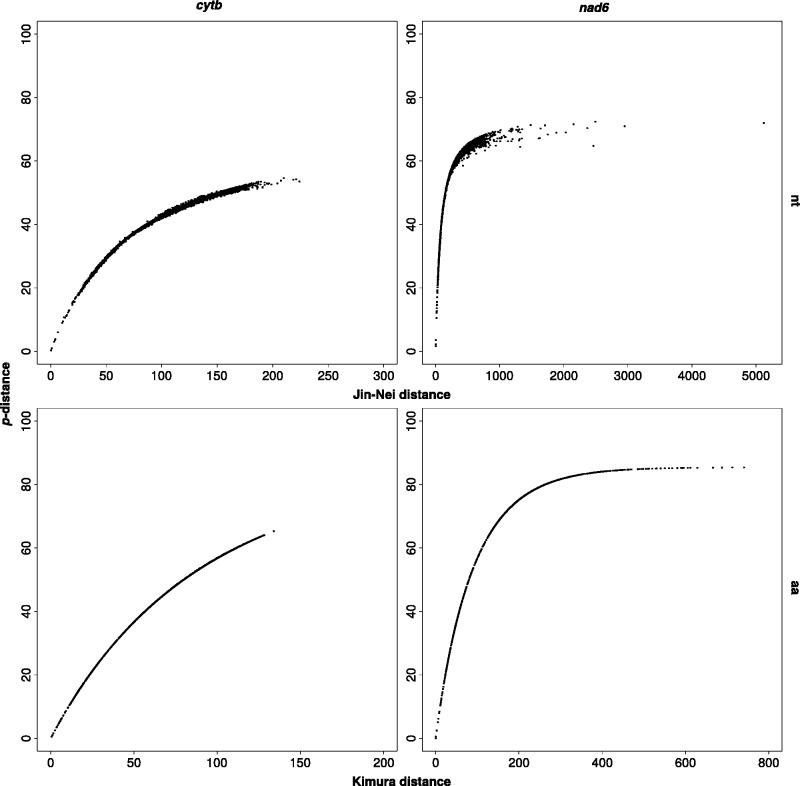
Fig. 4.—
Example of four saturation plots. Pairwise p-distance is plotted over Jin–Nei/Kimura distance for nucleotides (above)/amino acids (below), respectively; nt, nucleotides; aa, amino acids. All saturation plots are available as supplementary file S11, Supplementary Material online.

