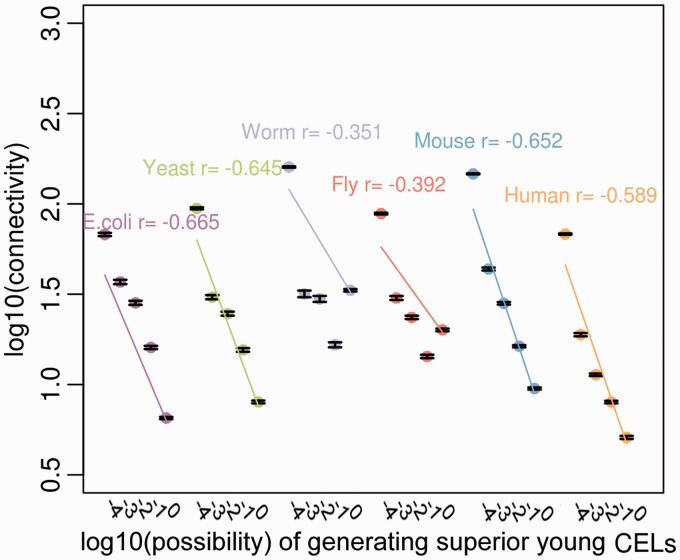
Fig. 3.—
Trends of gene connectivity and its possibility of generating superior young CELs among six organisms. The x-axis and y-axis represent log-transformed data. The genes are classified into five groups with different orders of magnitude of possibilities (−4, −3, −2, −1 and 0). The dots denote the mean log10-transformed connectivity of each possibility group and the error bars show the SEM. The lines indicate the significant regression correlation between log10-transformed connectivity and possibility scales (P < 2.2 × 10 − 16).

