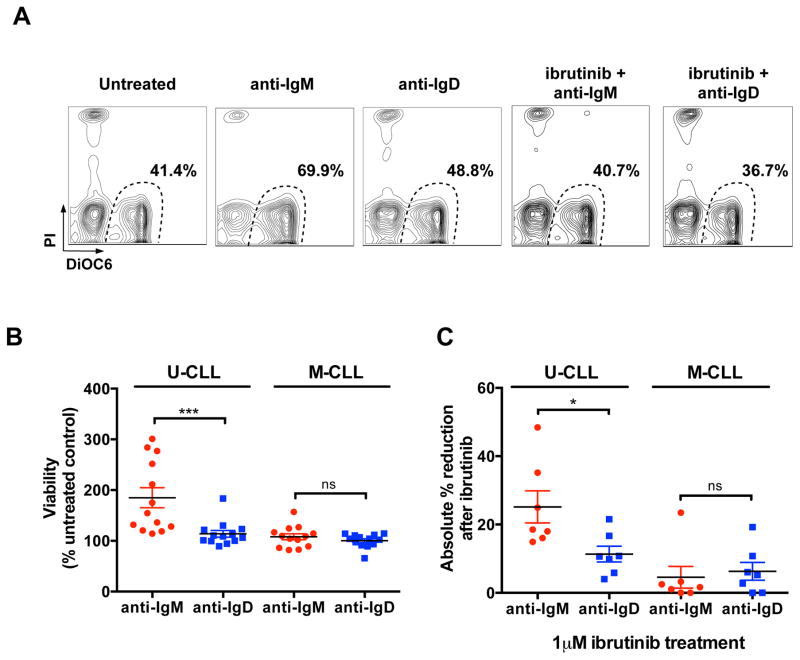
Figure 6. Viability assessment after BCR stimulation and ibrutinib treatment.
(A) Representative flow cytometry contour plots of viability assessment by DiOC6 and PI staining of one U-CLL case treated with anti-IgM or anti-IgD for 48 hours in the presence or absence of 1μM ibrutinib. (B) Mean ± SEM of viability after 48 hours of stimulation with anti-IgM or anti-IgD, as analyzed on 13 U-CLL and 13 M-CLL cases, and expressed as percentage (%) of the untreated control. ***P <0.001; ns: not significant; Mann-Whitney test. (C) Mean ± SEM of the absolute % reduction in viability after ibrutinib treatment, and 48 hours stimulation with anti-IgM or anti-IgD, as analyzed on 7 U-CLL and 7 M-CLL cases. *P <0.05; ns: not significant; Mann-Whitney test.

