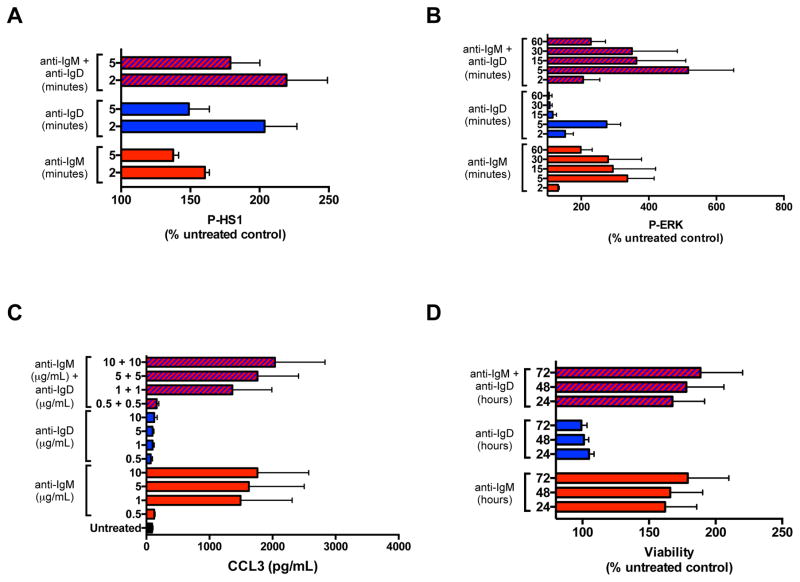
Figure 7. Functional outcomes of combination of anti-IgM and anti-IgD stimulation.
(A) Mean ± SEM of HS1 phosphorylation (P-HS1), after 2 and 5 minutes of anti-IgM or anti-IgD stimulation, or the combination of both, as analyzed by flow cytometry on 5 U-CLL cases, and expressed as percentage (%) of the untreated control. (B) Mean ± SEM of ERK phosphorylation (P-ERK), at serial time points following anti-IgM or anti-IgD stimulation, or the combination of both, as analyzed by flow cytometry on 4 U-CLL samples, and expressed as percentage (%) of the untreated control. (C) CCL3 measurement by ELISA in the supernatants of 4 U-CLL samples after a 24-hour stimulation with increasing concentrations (μg/mL) of anti-IgM or anti-IgD, or the combination of both. Displayed are the means ± SEM of chemokine concentrations in pg/mL. (D) Mean ± SEM of viability after 24, 48, or 72 hours of stimulation with anti-IgM or anti-IgD, or the combination of both, as analyzed on 5 U-CLL cases, and expressed as percentage (%) of the untreated control.

