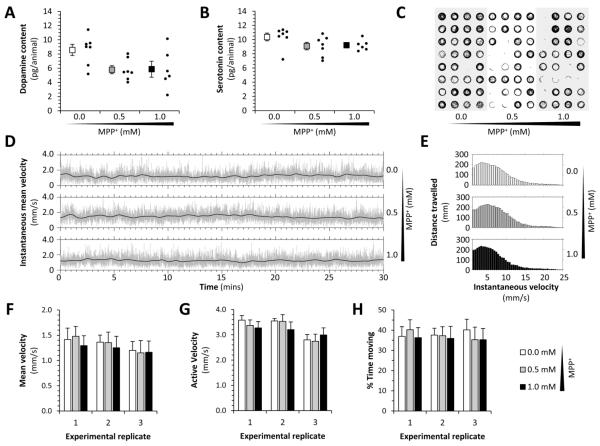
Figure 6. Neurochemistry and motor function in a presymptomatic zebrafish MPP+ model of Parkinson’s disease.
A, B: Whole-animal neurotransmitter levels following exposure to MPP+. The graphs show dopamine (A) and serotonin (B) levels in lysates from 60 pooled larvae, expressed as pg neurotransmitter per larva. Individual experimental replicates are shown (small markers) along with the mean (large markers) for each concentration of MPP+, using the subacute paradigm shown in figure 5A. Error bars show standard error of the mean.
C – H: 96 zebrafish larvae were exposed to 0, 0.5 or 1.0mM MPP+ subacutely as shown in figure 5A. The larvae were then transferred to individual wells of a 96-well plate in fresh medium, and their movements measured by analysis of a video stream (Cario et al., 2011; Zhou et al., 2014). (C) Representative vector plot showing the centroid locus of each zebrafish in 1000 consecutive video frames at 4 frames/sec. (D) Instantaneous mean velocity plots for each experimental group over 30 minutes of recording. The light gray lines show the mean displacement of all larval centroids in each experimental group at each frame transition of video stream, scaled to indicate velocity. The black lines show the same data averaged over a moving 30-frame window. (E) Histograms showing the total displacement of the larval centroids over the entire 60-minute recording (y-axis) at each instantaneous velocity (x-axis); a separate histogram is shown for each experimental group. (F) Mean velocity (total displacement/measurement time period), active velocity (total displacement/time moving) and % time moving (time moving/measurement time period) are shown for each experimental group (white bars, control; gray bars, 0.5mM MPP+; black bars, 1.0mM MPP+). Three independent biological replicates (n=32 each group) are shown for each parameter. Bars show mean +/− standard error. Data analyzed using one-way ANOVA.

