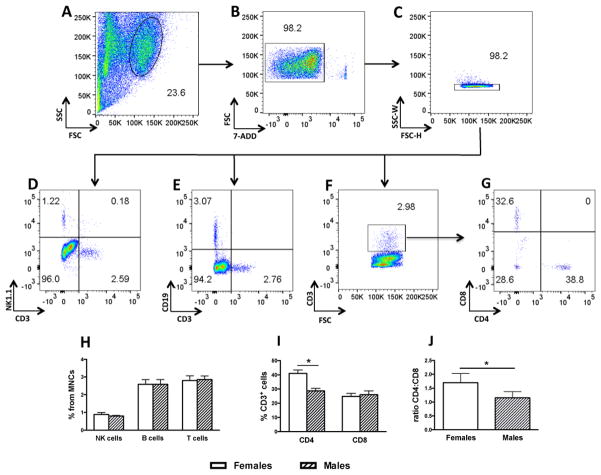
Figure 1.
Representative dot plots from a single mouse showing the gating strategy for lymphocyte subtype characterization in MNCs from wild type (WT) mice (n = 8 females and 8 males). A) Lymphocyte gate from brain MNCs. B) Live cells gate (7-ADD-negative). C) Singlet separation by SSC-W/FSC-H. D) NK cells (NK1.1+CD3−). E) B cells (CD19+CD3 −). F) T cells (total CD3+). G) T cell subpopulation in the CD3+ gate for CD4 and CD8. H) Proportion of NK, B and T cells in female and male brain MNCs. I) Proportion of CD3+/CD4+ and CD3+/CD8+ in female and male brain MNCs. J) CD4:CD8 ration in CD3 the fraction of female and male brain MNCs. * p < 0.05.

